
SANTA CLARA, California, August 22, 2026, 11:34 PDT
- Nvidia fell 4.6% last week, wiping out approximately $236 billion in market capitalization.
- Options are indicating an earnings swing of about 6%, equivalent to approximately $313 billion in either direction.
- Analysts on Wall Street anticipate revenue of $92.16 billion, representing just a 1.3% increase over the company’s guidance.
- The company is scheduled to release its fiscal second-quarter results on Wednesday following the close of U.S. trading.
NVIDIA Corporation NASDAQ:NVDA approaches earnings week with options implying a possible single-day market-value movement of almost $313 billion. This figure surpasses the market capitalization of many S&P 500 firms.
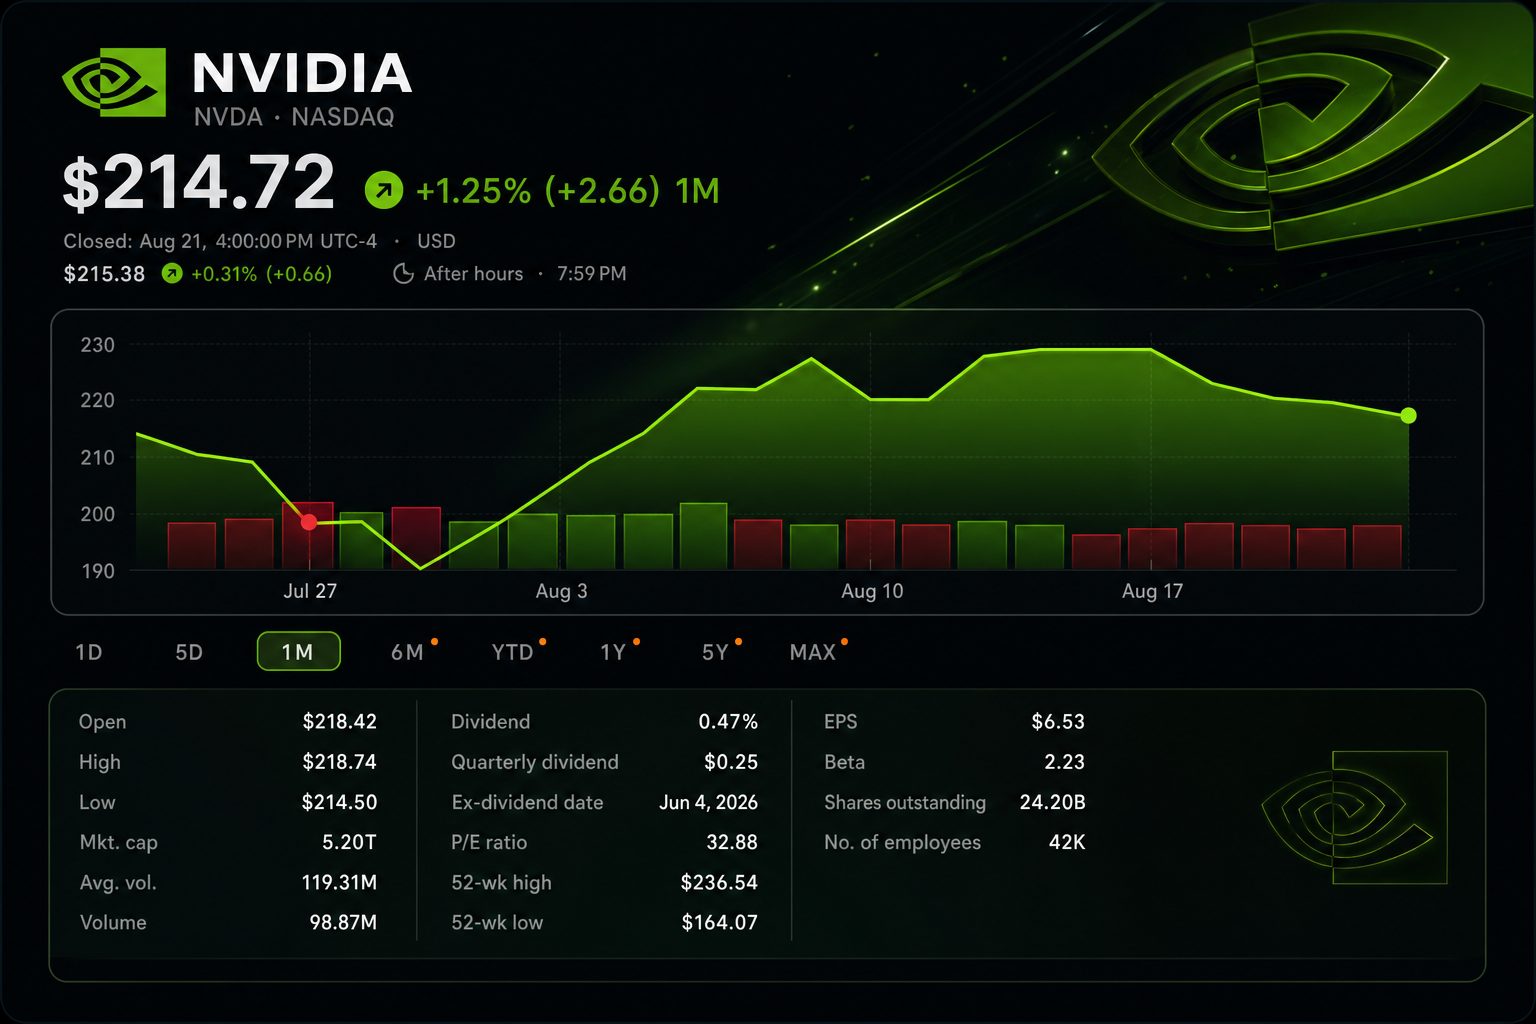
The margin is particularly narrow. Analysts are forecasting fiscal second-quarter revenue of $92.16 billion, only 1.3% higher than Nvidia’s guidance midpoint of $91 billion. Still, the stock is valued at $5.21 trillion.
As a result, investor attention turns to guidance rather than just another earnings beat. Shares ended Friday at $214.72, marking a 4.6% decline over the week. The Nasdaq Composite slipped 2.1%.
| Date | Close | Daily move | Volume |
|---|---|---|---|
| Aug. 17 | $225.01 | -0.07% | 93.68 million |
| Aug. 18 | $219.74 | -2.34% | 103.13 million |
| Aug. 19 | $217.56 | -0.99% | 96.80 million |
| Aug. 20 | $216.85 | -0.33% | 92.46 million |
| Aug. 21 | $214.72 | -0.98% | 97.94 million |
The selloff wiped roughly $236 billion off Nvidia’s market value, with shares now trading 9.2% under their 52-week peak of $236.54. While the drop somewhat reduces the pressure on earnings, it does not eliminate the risk tied to valuations.
Nvidia is set to announce results following the market close on Wednesday. The company plans its conference call for 2 p.m. PDT, with CFO commentary expected at approximately 1:20 p.m. PDT.
| Metric | Q2 FY2026 actual | Q1 FY2027 actual | Q2 FY2027 company view | Q2 FY2027 consensus |
|---|---|---|---|---|
| Revenue | $46.74 billion | $81.62 billion | $91.0 billion midpoint | $92.16 billion |
| Sequential growth | 6% | 20% | 11.5% | 12.9% |
| Year-over-year growth | 56% | 85% | 94.7% | 97.2% |
| Non-GAAP gross margin | 72.7% | 75.0% | 75.0% ± 0.5 point | Not disclosed |
The consensus indicates sales will be almost twice those of last year. Analysts project adjusted earnings of $2.09 per share, with Data Center revenue forecast to reach around $85.67 billion. That estimate suggests a 108% increase from a year ago.
Nvidia’s most recent report backs up these projections. The company’s first-quarter revenue jumped 85% to reach $81.6 billion. Data Center revenue increased 92% to $75.2 billion, and non-GAAP gross margin came in at 75.0%.
Chief Executive Jensen Huang described the construction of AI factories as “the largest infrastructure expansion in human history.” The following challenge is to see if incoming orders can maintain this momentum, especially with increasing financing costs.
| Date | Firm | Recommendation | Price target | Upside from $214.72 |
|---|---|---|---|---|
| Aug. 21 | Benchmark | Buy | $335 | 56.0% |
| Aug. 21 | BMO Capital | Outperform, initiated | $340 | 58.3% |
| Aug. 20 | Oppenheimer | Buy | $265 | 23.4% |
| Aug. 19 | Stifel | Buy | $282 | 31.3% |
| Aug. 18 | TD Cowen | Buy | $275 | 28.1% |
Analysts stay positive on outlook. The current consensus, taken from 59 analysts, sees an average price target of $304.73, representing a 41.9% premium to Friday’s closing price. Projections span from $180 to $500.
Options trading shows less calm. A 6% implied shift corresponds to about $201.84 at the low end and $227.60 at the high. Nvidia would require the higher move just to reach the peak seen last Monday.
Broader market forces are adding strain. Last week, the 10-year Treasury yield moved close to 4.7%, and crude prices climbed toward $95. Elevated discount rates put the greatest burden on growth stocks with high valuations.
Key metrics for investors include third-quarter revenue guidance, gross margin, and the timeline for Vera Rubin production. Sales connected to China continue to be a variable. Nvidia’s forecast for the second quarter anticipated zero Data Center compute revenue from China.
Risks: After a 16% rise in the stock this year, a modest revenue beat might fall short of expectations. Margins could face headwinds from component costs, export restrictions, customer financing, and quicker chips produced by Advanced Micro Devices NASDAQ:AMD or Broadcom NASDAQ:AVGO. More optimistic guidance would counter that negative outlook.
The main benchmark is evident. Analysts project a $92 billion quarter. Investors seek confirmation that Nvidia can maintain both its growth pace and a 75% margin throughout the autumn.
Related articles: NASDAQ:NVDA