
IRVING, Texas, August 23, 2026, 03:15 CDT — Vistra’s market value dropped by $4 billion in the past week, but analysts maintain a forecast for shares to climb as much as 62%.
- Vistra dropped 8.05% over the past week, wiping out around $4.0 billion in market capitalization.
- Four analysts maintained positive ratings, setting targets between 59% and 87% higher than Friday’s closing price.
- Adjusted EBITDA increased by 31% in the second quarter, with all 2026 generation fully hedged.
- Nvidia results, PCE inflation data and Jackson Hole take center stage next week, challenging AI-driven valuations.
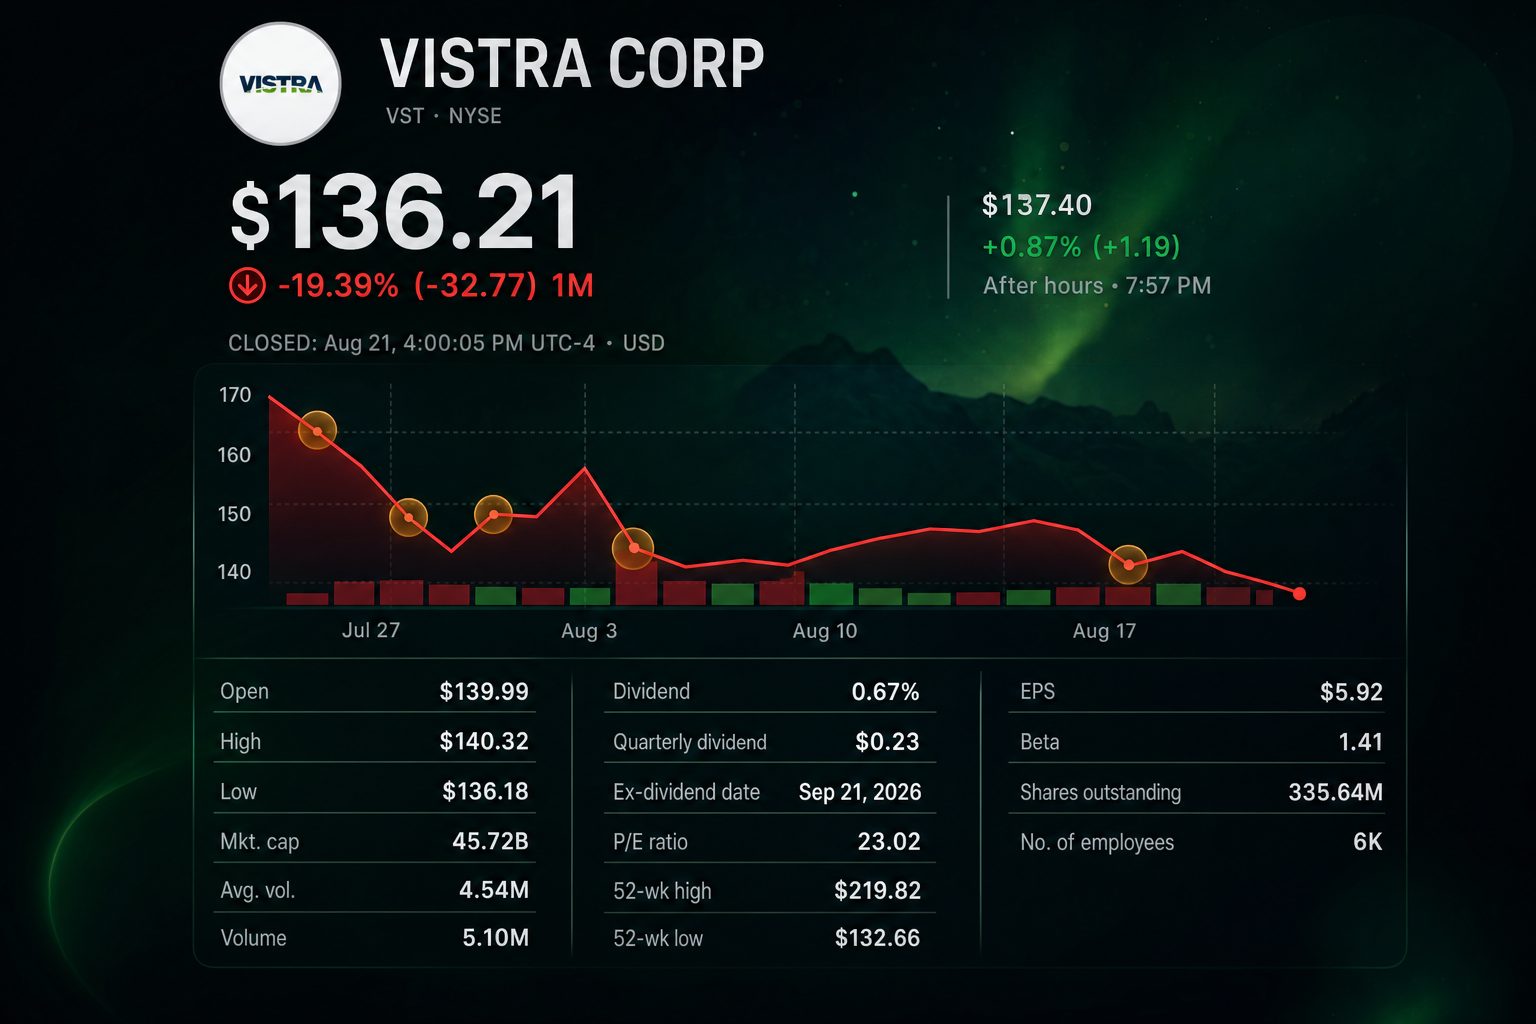
Vistra Corp. NYSE:VST dropped 8.05% over the week, even as analysts issued four new positive calls. Shares of the power producer finished Friday at $136.21, a daily decrease of 1.96%. With August’s share count, Vistra’s preliminary weekly market capitalization loss stands at approximately $4.0 billion.
The separation is significant. Analysts continue to assess Vistra as an AI-related growth enterprise. Investors approached it as a long-term asset during the rise in Treasury yields. The 10-year yield stood near 4.71% on Friday, increasing the rate used to discount anticipated future gains in power demand.
| Price lens | Latest reading | Investor signal |
|---|---|---|
| Aug. 21 close | $136.21 at 4:00 p.m. EDT | Shares extended slide to a second session |
| Five-day change | -8.05% | Market value dropped by about $4.0 billion |
| 2026 change | -15.57% | Premium linked to AI momentum squeezed |
| 52-week high | $219.82 | Shares are trading 38.04% beneath high |
| Friday volume | 4.9 million | Roughly 9% higher than 50-day moving average |
The selloff took place without any fresh operational warnings. On August 7, Vistra posted an ongoing-operations adjusted EBITDA of $1.77 billion for the second quarter, a 31% increase from the previous year. However, net income was down 7% at $305 million due to unrealized hedge losses.
| Adjusted EBITDA | Q2 2026 | Q2 2025 | Change |
|---|---|---|---|
| Retail | $773 million | $756 million | +2% |
| Texas | $311 million | $142 million | +119% |
| East | $642 million | $418 million | +54% |
| West | $68 million | $49 million | +39% |
| Ongoing operations | $1.77 billion | $1.35 billion | +31% |
Chief Executive Jim Burke described the results as “another strong quarter.” The growth was mainly due to higher realized energy and capacity prices. The integration of Lotus plants added to the positive impact for the entire quarter. The majority of the gains came from Texas and East.
Management reiterated guidance for 2026 adjusted EBITDA, maintaining the range at $6.8 billion to $7.6 billion. The forecast for adjusted free cash flow before growth was also unchanged at $3.93 billion to $4.73 billion. Projected generation remained nearly fully hedged for 2026, with 94% hedged for 2027 and 72% for 2028.
| Analyst | Date | Rating | Target | Upside vs. $136.21 |
|---|---|---|---|---|
| Morgan Stanley | Aug. 21 | Overweight | $227 | 66.7% |
| DBS Bank | Aug. 20 | Buy | $216 | 58.6% |
| TD Cowen | Aug. 19 | Buy | $221 | 62.2% |
| BNP Paribas | Aug. 19 | Outperform | $255 | 87.2% |
| Goldman Sachs | Aug. 12 | Buy | $206 | 51.2% |
Morgan Stanley lifted its price target to $227 from $212 on Friday. DBS initiated coverage with a $216 target on Thursday. TD Cowen reduced its target by $1, and BNP Paribas lowered its target by $27. Both maintained positive ratings. The adjustments indicate confidence, while also highlighting increased uncertainty regarding the earnings multiple.
The consensus is notably broad. Nineteen analysts assign an average price target of $220.56. Targets range from a low of $106 to a high of $313. This wide spread puts the cost of capital on par with near-term EBITDA in terms of importance.
| Capital and visibility | Reading | What it means |
|---|---|---|
| Repurchases since Nov. 2021 | About $6.5 billion | Share total down close to 30% |
| Remaining authorization | About $1.2 billion | Represents possible demand at 2.6% of market cap |
| 2026 EBITDA guidance | $6.8–$7.6 billion | No cut in August |
| 2027 EBITDA opportunity | $7.4–$7.8 billion | Does not include Cogentrix or Meta deals |
| June liquidity | $6.30 billion | Enables acquisition and cushions volatility |
Since November 2021, Vistra has bought back approximately $6.5 billion in shares. As of August 3, there was around $1.2 billion left authorized for repurchases. At Friday’s market value, the remaining sum represents nearly 2.6% of the company’s projected equity value.
The growth narrative faces a direct test next week when Nvidia Corp. NASDAQ:NVDA is set to report on Wednesday at 5:00 p.m. EDT. Robust demand in the data-center division may bolster suppliers of power. Conversely, a weak guidance could put pressure on valuations.
Macro factors could take precedence. July PCE inflation data is due Wednesday at 8:30 a.m. EDT. The Jackson Hole symposium runs August 27–29, with Fed Chair Kevin Warsh scheduled to speak on Friday. Rising yields would continue to weigh on long-duration power names.
Other key peers also declined on Friday. NextEra Energy Inc. NYSE:NEE slipped 1.62%. Southern Co. NYSE:SO retreated 2.72%, while American Electric Power Co. NASDAQ:AEP gave up 3.79%. Vistra posted a steeper weekly loss as a larger portion of its valuation derives from expected gains in merchant power and data centers.
Risks: Results remain sensitive to fluctuations in power prices, severe weather, plant shutdowns, and hedge marks. Execution risk is heightened by Cogentrix integration, leverage, and large-load contract exposure. While falling rates may boost valuation, a fresh rise in yields could offset robust performance.