
LOS GATOS, California, August 23, 2026, 01:55 PDT
- To Catch a Cheater started streaming on Netflix in the United States from August 20.
- Weekend search activity has increased, yet Netflix has not released any viewership numbers or Top 10 ranking.
- NFLX rose 1.8% over the past week, increasing its market capitalization by about $6 billion.
- Analysts project an average upside of 18.2%, with the main discussion centered on engagement growth.
Netflix Inc. NASDAQ:NFLX added around $6 billion in market value over the past week. Over the weekend, a spike in search interest for To Catch a Cheater provides a minor test for the company’s content strategy.
The signal shows potential but lacks completeness. The licensed thriller became available on Netflix’s U.S. platform on Thursday. There is no official viewing figure or appearance in the weekly Top 10 at this time.
The gap is significant beyond just a single film. Netflix reports a 2% rise in viewing hours during the first half. Investors are seeking greater evidence that audience engagement will sustain pricing, advertising, and double-digit revenue increases.
To Catch a Cheater has a runtime of 87 minutes and is rated TV-14. The story centers on three mothers entangled in suspicion following a fatal game. U.S. streaming platforms started including Netflix availability on August 20.
| Title signal | Verified reading | Investor meaning |
|---|---|---|
| U.S. Netflix availability | August 20, 2026 | New entry in catalog |
| Runtime | 87 minutes | Minimal viewing duration |
| Weekend search trend | Active August 23 | Indicates interest, not actual views |
| Official Netflix views | Not published | Economic impact unclear |
| Official weekly Top 10 rank | Not yet available | Upcoming data milestone |
| Production origin | A&E Networks title | Acquired, not a Netflix production |
Interest in the search increased over the weekend, while U.S. markets remained shut, leaving the stock unaffected by the news. Monday will mark the first opportunity to gauge investor reaction.
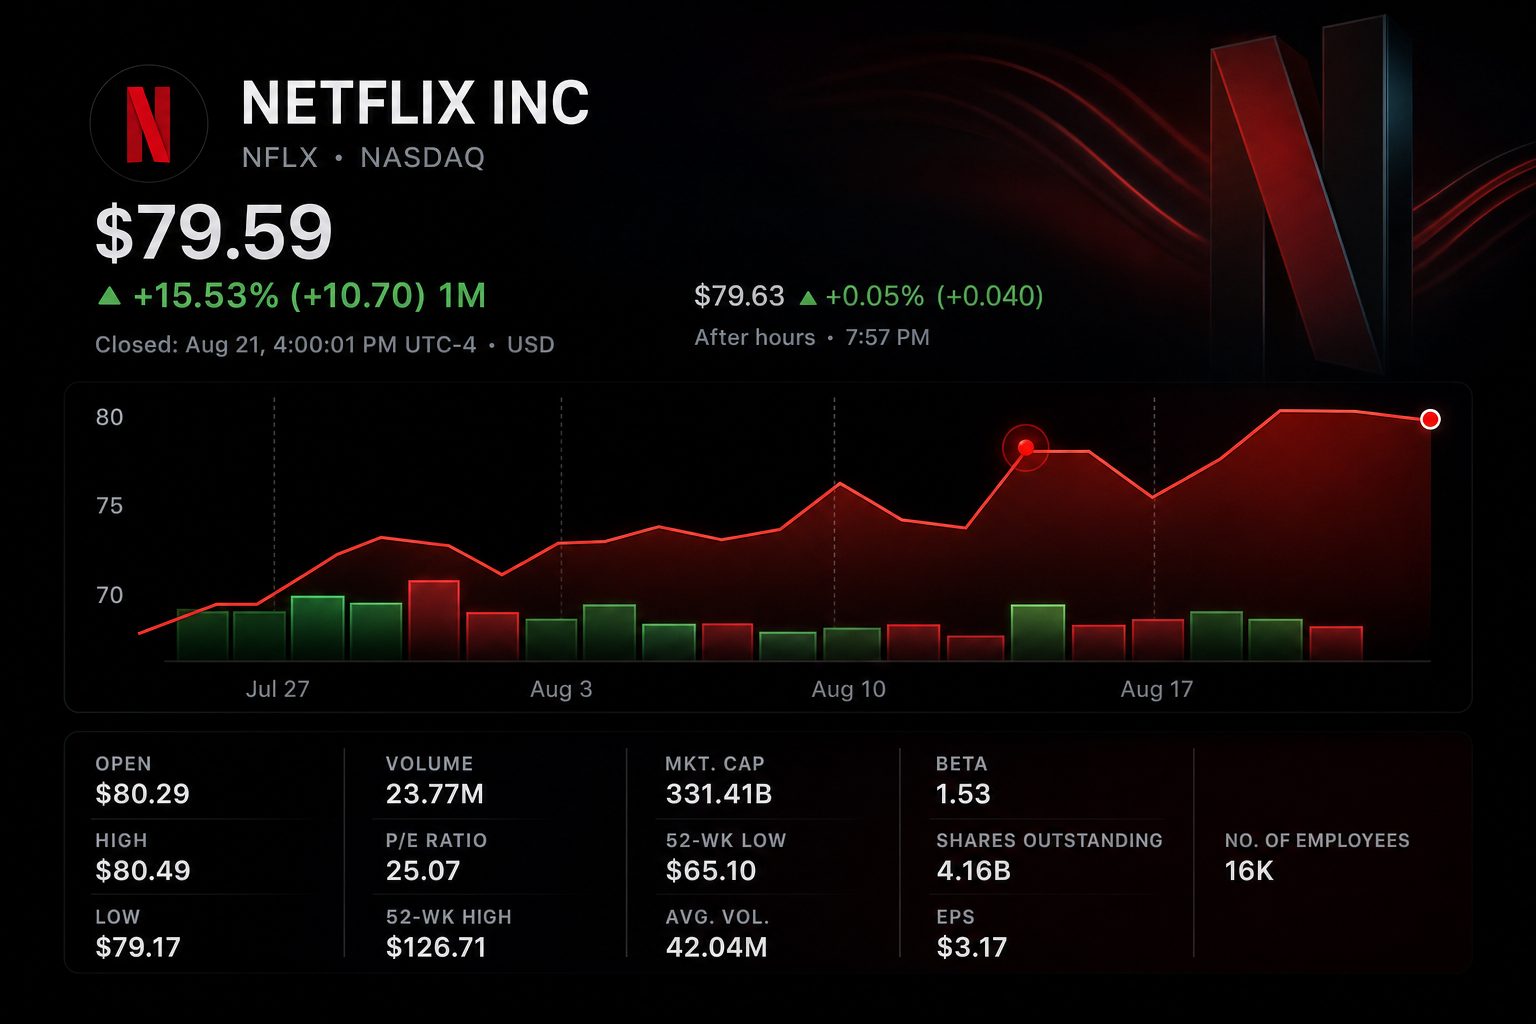
NFLX finished Friday at $79.59, a decrease of 0.69% for the session. Despite the decline, shares rose 1.83% from August 14. The stock continues to trade 37.2% under its 52-week peak.
| Date | NFLX close | Daily move |
|---|---|---|
| Aug. 14 | $78.16 | -0.10% |
| Aug. 17 | $76.02 | -2.74% |
| Aug. 18 | $77.77 | +2.30% |
| Aug. 19 | $80.22 | +3.15% |
| Aug. 20 | $80.14 | -0.10% |
| Aug. 21 | $79.59 | -0.69% |
| Change for the week | +$1.43 | +1.83% |
The weakness seen on Friday was isolated to individual media firms. Shares of Walt Disney Co. NYSE:DIS, Comcast Corp. NASDAQ:CMCSA, and Warner Bros. Discovery Inc. NASDAQ:WBD advanced. The S&P 500 closed up 0.43%.
| Friday comparison | Close | Move |
|---|---|---|
| Netflix | $79.59 | -0.69% |
| Disney | $107.78 | +0.43% |
| Comcast | $26.85 | +1.63% |
| Warner Bros. Discovery | $28.55 | +1.13% |
| S&P 500 | 7,674.37 | +0.43% |
Doug Anmuth, an analyst at JPMorgan, described compelling content as the key driver among several ongoing engagement strategies. Anmuth noted that Netflix lacks a “single silver bullet” for boosting engagement or revenue. He set a price target of $85, implying a 6.8% potential gain. JPMorgan note coverage
The disparity in competition is apparent. In June, Netflix accounted for 7.9% of U.S. television viewing time. YouTube, operated by Alphabet Inc. NASDAQ:GOOGL, topped media distributors with a 13.8% share.
| Engagement measure | Reading | Comparison |
|---|---|---|
| Netflix H1 view hours | Above 97bn | Highest company total for a half |
| H1 view-hours growth | Up 2% | Slight increase |
| Average daily H1 viewing | Roughly 536m hours | Based on 181 days |
| Netflix U.S. TV share, June | 7.9% | Fell 0.1 point from May |
| YouTube distributor share | 13.8% | 5.9 points higher than Netflix |
According to management, “engagement is healthy.” Second-quarter revenue increased by 13%, but operating margin declined by 0.7 points. The company anticipates 2026 advertising revenue to be about $3 billion.
| Q2 and 2026 measure | Reading | Change or guide |
|---|---|---|
| Q2 revenue | $12.56bn | up 13% versus a year ago |
| Operating income | $4.19bn | increased by 11% |
| Operating margin | 33.4% | declined 0.7 percentage points |
| Net income | $3.40bn | 9% growth |
| Free cash flow | $1.53bn | reported for Q2 |
| 2026 revenue outlook | $51.0bn–$51.4bn | expected to rise 13% to 14% |
| 2026 operating margin | 31.5% | company projects |
Wall Street holds a positive but split stance. Out of 51 monitored recommendations, 36 are rated positive and 15 are holds. The average price target of $94.04 signals an 18.2% rise from Friday’s close.
| Analyst recommendation | Count | Share |
|---|---|---|
| Strong buy | 29 | 56.9% |
| Buy | 7 | 13.7% |
| Hold | 15 | 29.4% |
| Sell / strong sell | 0 | 0% |
| Average target | $94.04 | +18.2% |
| Target range | $70–$135 | -12.1% to +69.6% |
The next solid indicator is specific. Investors are advised to pay attention to Netflix’s weekly U.S. Top 10 lists, any reported viewership figures, and whether the title maintains momentum after its opening weekend.
Risks: Search momentum could decline without leading to significant viewership. The financial details of the licensed film remain confidential, and a slower pace of U.S. user activity or reduced advertising might weigh on Netflix’s market value.
Related articles: NASDAQ:NFLX