
NEW YORK, August 23, 2026, 5:28 PM EDT
- Netflix’s market value increased by approximately $5.96 billion last week.
- All of the increase occurred prior to Blood Sacrifice premiering on streaming platforms on Thursday.
- The stock shed approximately $2.62 billion over Thursday and Friday.
- The Top 10 release on Tuesday provides the initial title-level viewing check.
Netflix, Inc. NASDAQ:NFLX saw its market capitalization increase by about $5.96 billion over the past week. However, the timing raises doubts that Blood Sacrifice was the catalyst for this growth. The bulk of the stock’s gains had occurred before the show premiered on Thursday.
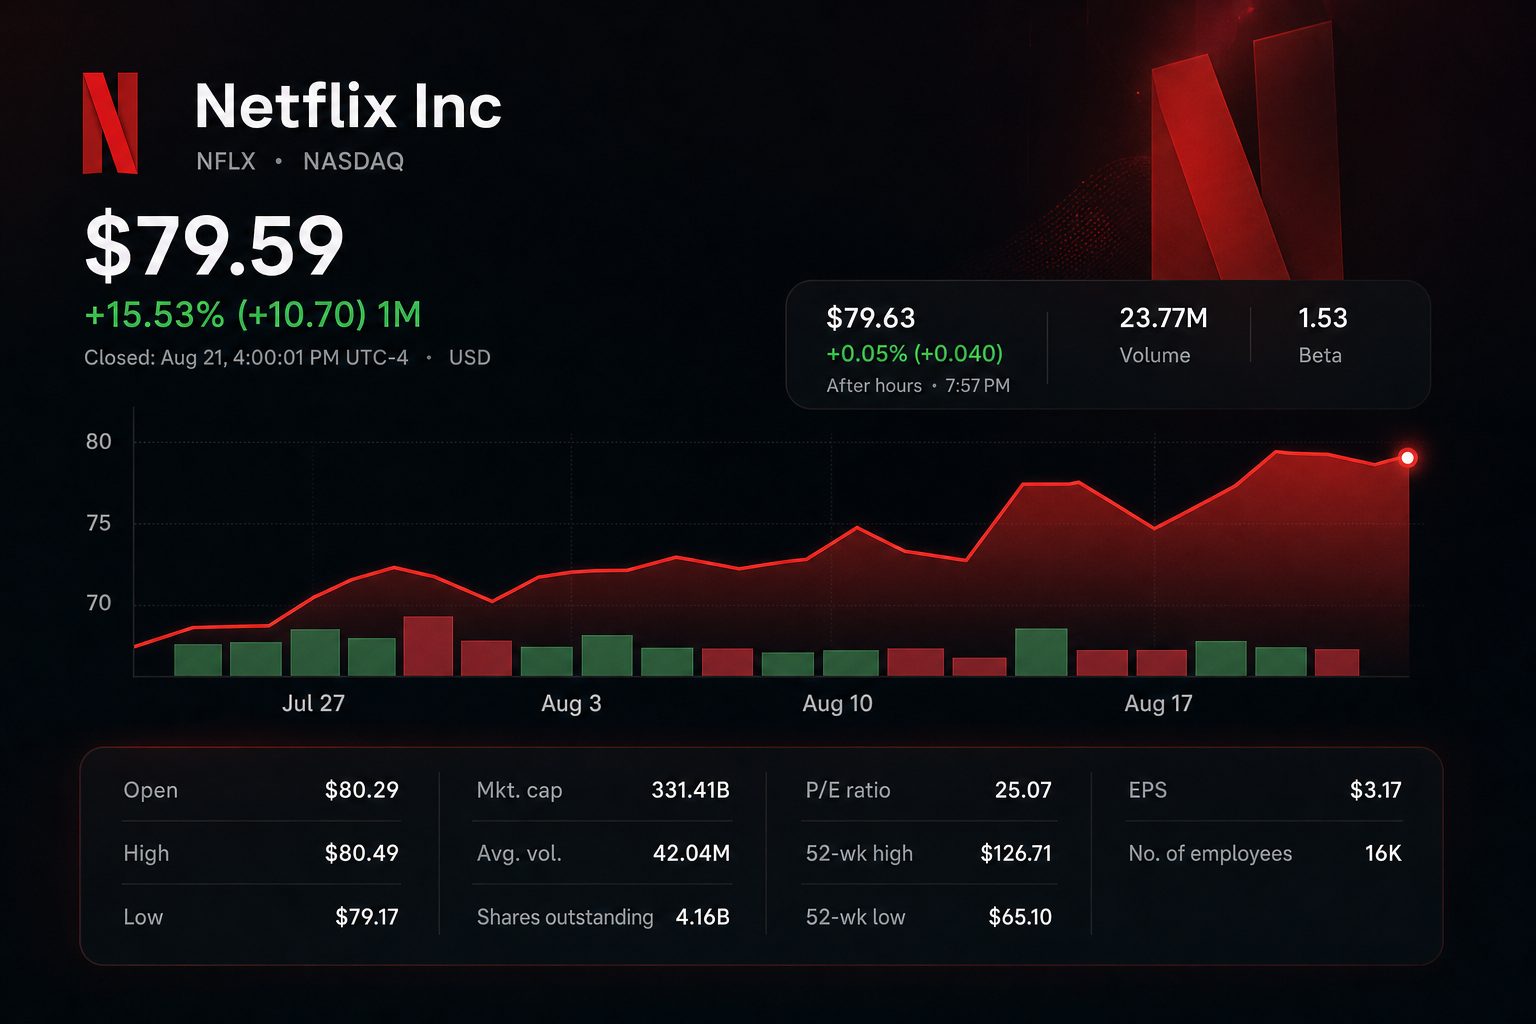
Shares finished Friday at $79.59, increasing 1.83% compared to the previous Friday. Based on daily market-value data, that figure represents approximately $5.96 billion. The most significant gain occurred earlier in the week, as Tuesday and Wednesday together added around $17.5 billion from Monday’s close.
| Date | Close | Daily move | Estimated market value | Event |
|---|---|---|---|---|
| Aug. 14 | $78.16 | -0.10% | $325.45B | Base from prior week |
| Aug. 17 | $76.02 | -2.74% | $316.54B | Before release |
| Aug. 18 | $77.77 | +2.30% | $323.83B | Before release |
| Aug. 19 | $80.22 | +3.15% | $334.03B | Before release |
| Aug. 20 | $80.14 | -0.10% | $333.70B | Series debuts |
| Aug. 21 | $79.59 | -0.69% | $331.41B | First close after launch |
The difference is significant. While search interest may signal increased attention, it does not establish causality. Netflix declined by 0.10% on launch day and lost another 0.69% on Friday, together wiping approximately $2.62 billion from the company’s estimated value since Wednesday.
Blood Sacrifice is a Swedish crime thriller series in five parts, launching worldwide on August 20. Netflix revealed the premiere date in June. Series creator George Kay described it as “a love story between an estranged father and son duo.” Netflix announcement
| Timing test | Measured result | Investor reading |
|---|---|---|
| Aug. 17–19 | Shares rose 5.52% from Monday’s closing | Gains came before debut |
| Aug. 20 | Shares slipped 0.10%, losing roughly $0.33B | No immediate boost on launch |
| Aug. 20–21 | Losses totaled about $2.62B from Wednesday’s level | Markets reacted negatively at first |
| Aug. 25 | Earliest Top 10 weekly update after debut | First data at the title level |
The report on Tuesday will reflect just four days of release, restricting available conclusions. However, the rankings and reported view numbers are likely to indicate if the trend resulted in widespread viewing.
No single programme is enough to drive Netflix’s quarterly performance. The streaming giant reported revenue of $12.56 billion for the second quarter. The operating margin was 33.4%, as executives maintained a full-year margin goal of 31.5%.
| Operating measure | Q2 / 2026 outlook | Why investors care |
|---|---|---|
| Q2 revenue | $12.56B; +13% year over year | Growth continues, as membership, price and advertising drive performance |
| Q2 operating margin | 33.4% | High operating margin indicates strong content profitability |
| 2026 revenue outlook | $51.0B–$51.4B | Financial significance of individual releases is modest |
| 2026 ad-revenue goal | About $3B | Greater engagement gains importance with ad expansion |
| 2026 free-cash-flow outlook | About $12.5B | Facilitates investment in programming and share repurchases |
On Friday, the trend set by headlines was also tested. Shares in Netflix declined as the S&P 500 advanced 0.43%. Walt Disney Co. NYSE:DIS finished up 0.43%, while Comcast Corp. NASDAQ:CMCSA climbed 1.63%.
| Friday comparison | Close | Move |
|---|---|---|
| Netflix NASDAQ:NFLX | $79.59 | -0.69% |
| Disney NYSE:DIS | $107.78 | +0.43% |
| Comcast NASDAQ:CMCSA | $26.85 | +1.63% |
| S&P 500 | 7,674.37 | +0.43% |
Wall Street maintains a positive outlook, though opinions are widely split. The target range of $70–$135 covers an 81.7% spread versus Friday’s close. J.P. Morgan’s new $85 price target signals just 6.8% potential upside, while BMO’s $135 projection suggests close to 70%.
| Analyst / firm | Date | Recommendation | Target | Upside vs. $79.59 |
|---|---|---|---|---|
| Doug Anmuth / J.P. Morgan | Aug. 21 | Buy | $85 | 6.8% |
| Brian Pitz / BMO Capital | Aug. 14 | Buy | $135 | 69.6% |
| John Hodulik / UBS | July 17 | Buy | $115 | 44.5% |
| Morgan Stanley | July 14 | Overweight | $90 | 13.1% |
| Rosenblatt | June 4 | Neutral | $96 | 20.6% |
Netflix’s shares are valued at 25.1 times their trailing earnings and 23.0 times forward earnings. With a market capitalisation of $331.41 billion, even minor percentage shifts appear significant. This valuation maths can turn a routine weekly rise into an appealing storyline for content.
The days ahead will provide a clearer test. Investors can weigh the viewing rank released on Tuesday against the share movement on Wednesday. A robust debut could bolster arguments for engagement, but it would fall short of confirming a six-billion-dollar causal link.
Risks: Weekly viewing figures are incomplete and limited to individual titles. Broader interest rates, market volatility, and updates from analysts could outweigh the response to a single release.
Related articles: NASDAQ:NFLX