
NEW YORK, August 3, 2026, 06:04 EDT
- Amazon shares were at $275.17 in premarket trade, 1.2% under their 52-week peak.
- AWS backlog increased by $132 billion from the previous quarter, reaching $496 billion.
- AWS accounted for 60.5% of operating income in the quarter, while contributing 21.1% of total sales.
Amazon stock traded at $275.17 in premarket action on Monday, edging up 1.3%. Shares remained 1.2% under their 52-week peak. Nasdaq’s main session was yet to begin.
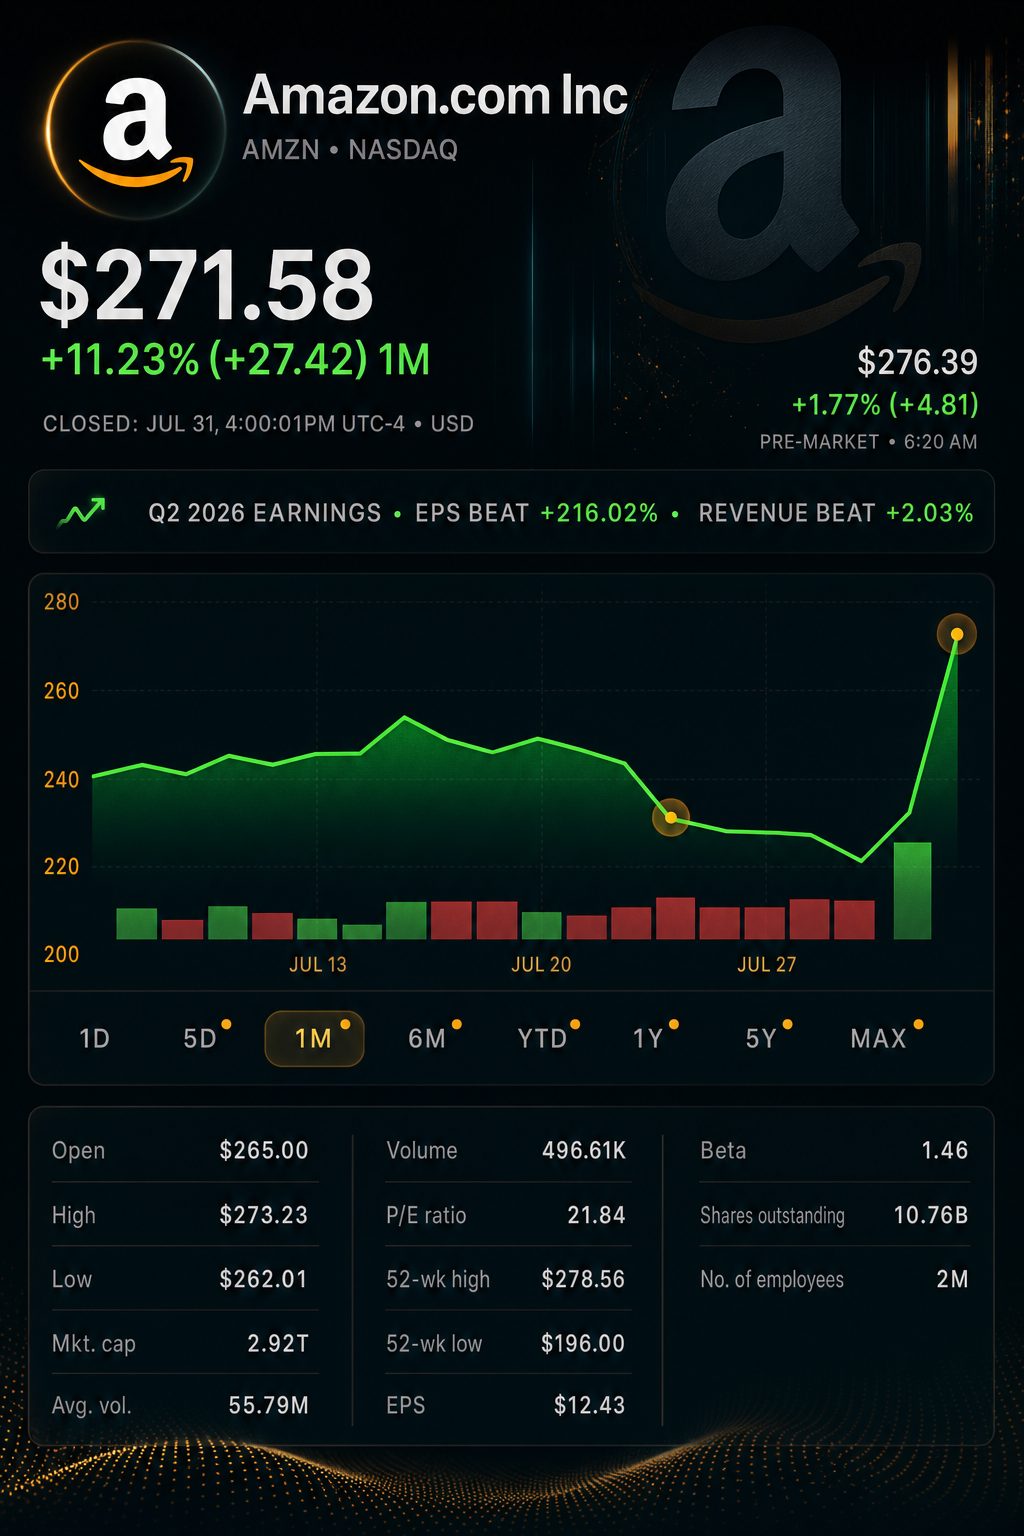
Amazon shares soared 15.3% Friday, closing out the week with a 17.0% advance. The company significantly outperformed key benchmarks. Investors reassessed its AI investments following accelerated AWS growth and improved margins.
| Return period | Amazon | Nasdaq Composite | S&P 500 |
|---|---|---|---|
| Friday, July 31 | +15.32% | +1.00% | +0.70% |
| Week ending July 31 | +17.00% | +1.59% | +1.05% |
Amazon’s weekly return is calculated based on its closing prices from July 24 and July 31.
The AWS backlog stood out as the most direct indicator of demand. It rose to $496 billion, compared to $364 billion in the prior quarter. This represented an increase of $132 billion, equal to 36%.
Amazon boosted its projected capital expenditure for 2026 by $20 billion, reaching a total of $220 billion. The backlog rose by a factor of 6.6 relative to the increased spending outlook. Due to differences in timeframes and accounting methods, this does not represent a rate of return. The figures indicate that backlog is outpacing the updated investment plan.
Amazon CEO Andy Jassy stated the company “still not have enough capacity” even with spending at current levels. Nearly all AWS capacity for 2027 has been booked, and some supply for 2028 is already reserved by customers. Reuters
Trading volume on Friday totaled 129.1 million shares, which is 2.55 times higher than the 65-day average. The surge indicated a widespread repricing instead of limited after-hours activity.
Amazon reported that operating profit in the second quarter rose more rapidly than revenue, with the bulk of the additional profit coming from AWS.
| Metric | Q2 2026 | Q2 2025 | Change |
|---|---|---|---|
| Total sales | $200.6 billion | $167.7 billion | up 20% |
| Operating income | $27.5 billion | $19.2 billion | increase of 43% |
| AWS sales | $42.2 billion | $30.9 billion | up 37% |
| AWS operating income | $16.6 billion | $10.2 billion | rise of 64% |
| Advertising sales | $19.8 billion | $15.7 billion | increase of 26% |
| Trailing free cash flow | $(7.6) billion | $18.2 billion | $(25.8) billion change |
AWS contributed 60.5% of the firm’s operating income, while representing just 21.1% of total sales. Its operating margin climbed to 39.4%, an increase of 6.5 percentage points from a year earlier.
Caution is advised with the stated $62.6 billion net profit figure. This number reflects $53.4 billion in pre-tax other income, mostly related to Anthropic. Operating income offers a clearer picture of performance for the quarter.
Cash flow acts as a balancing factor. According to Jassy, Amazon begins to invest in data centres about two years prior to their launch. He noted that AI servers typically pay for themselves in under three years. This means cash is spent ahead of when the associated revenue is received.
| Demand and cash measure | Previous quarter | Latest quarter | Sequential movement |
|---|---|---|---|
| AWS revenue growth | 28% | 37% | +9 percentage points |
| AWS operating margin | 37.7% | 39.4% | +1.7 points |
| AWS backlog | $364 billion | $496 billion | +$132 billion |
| 2026 capital-spending guide | $200 billion | $220 billion | +$20 billion |
| Trailing property and equipment purchases | $147.3 billion | $169.0 billion | +$21.7 billion |
| Trailing free cash flow | $1.2 billion | $(7.6) billion | $(8.8) billion |
Other cloud companies also saw faster growth. Microsoft Corp. NASDAQ:MSFT posted a 43% increase in Azure and related cloud service revenue. Alphabet Inc. NASDAQ:GOOGL recorded Google Cloud growth of 82%.
| Cloud business | Quarterly revenue | Revenue growth | Operating margin | Backlog or RPO | 2026 company capex |
|---|---|---|---|---|---|
| Amazon AWS | $42.2 billion | 37% | 39.4% | $496 billion | $220 billion |
| Microsoft Azure | Not disclosed | 43% | Not disclosed | $678 billion* | $175 billion |
| Alphabet Google Cloud | $24.8 billion | 82% | 35.6% | $514 billion | $195–205 billion |
Microsoft’s reported number refers to total commercial remaining performance obligations across the company, rather than specific to Azure. Companies define backlog in varying ways; all capital expenditure data shown are for entire companies.
Amazon did not lead in cloud growth pace. The company reported 37% growth and a 39.4% operating margin for AWS. “Amazon is earning the right to keep spending,” said Thomas Monteiro, analyst at Investing.com. Reuters
Retail and advertising lessened reliance on a single engine. Online-store revenue increased 15% to $70.4 billion. Services for third-party sellers were up 16%, and advertising was higher by 26% at $19.8 billion.
Management projected third-quarter sales between $197 billion and $202 billion, with the midpoint coming in 2.2% under the $203.9 billion consensus estimate from FactSet. Shifting Prime Day to June cuts nearly four percentage points off the reported growth for the third quarter. Operating income is expected in the range of $22.5 billion to $26.5 billion.
Amazon’s investor calendar lists no upcoming company event this week. Investors are watching for the ISM services data release on Wednesday, August 5. The July jobs report is next, due at 08:30 EDT on Friday, August 7.
Risks: Backlog does not represent present revenue and may be slow to turn into sales. Increased memory expenses have contributed to a rise in intended outlays. Free cash flow remains in the red, and third-quarter sales projections fall short of analyst expectations.
Related articles: NASDAQ:AMZN