
NEW YORK, August 9, 2026, 10:01 EDT
- According to Counterpoint’s initial tracker, phones priced over $600 accounted for a record 29% of global unit sales.
- Apple and Samsung accounted for 84% of premium sales, suggesting a 24.36% presence in the global premium-only market.
- About 85% of the yearly increase in that footprint was driven by category expansion rather than by gaining market share.
Globally, premium smartphones with a wholesale average selling price above $600 accounted for 29% of unit sales in H1 2026. Apple and Samsung together captured 84% of this category. As a result, their premium offerings made up about 24.36% of total smartphone units, increasing from 20.50% in the previous year. Counterpoint’s preliminary rounded shares were used for this calculation.
A more significant indicator for the market is the source of that growth. Approximately 85% of the pair’s 3.86-point increase stemmed from growth in the premium tier. The remaining 15% was driven by their collective segment share moving up to 84% from 82%.
This is primarily a case of pricing and product mix, rather than one of gaining market share. The trend benefits suppliers who can offer financing options, possess previous-generation flagships, and have the capacity to handle increased memory expenses.
Initial premium-market framework
| Metric | H1 2025 | H1 2026 | Change |
|---|---|---|---|
| Global premium smartphone unit proportion | 25% | 29% | up 4 percentage points |
| Apple’s share of premium segment | 63% | 65% | rises 2 points |
| Samsung’s share of premium segment | 19% | 19% | No change |
| Apple and Samsung together | 82% | 84% | increase of 2 points |
| Premium segment unit growth | — | 5% year-on-year | — |
Counterpoint’s June 2026 handset tracker is an initial release. Premium refers to devices with a wholesale average selling price of $600 or higher.
Counterpoint senior analyst Harshit Rastogi said, “the price gap with premium devices … is narrowing.” Companies are increasing trade-in, financing, and buyback offers. Premium device sales increased by 5% compared with the prior year. MacRumors
Estimated share of total smartphone units accounted for by premium models
| Premium-unit exposure | H1 2025 | H1 2026 | Change |
|---|---|---|---|
| Apple | 15.75% | 18.85% | up 3.10 points |
| Samsung | 4.75% | 5.51% | up 0.76 point |
| Combined | 20.50% | 24.36% | up 3.86 points |
These figures are based on the author’s estimates, not overall vendor market allocations. Of the total increase, 3.28 points resulted from category expansion, while 0.58 point reflected the duo’s greater premium share. Totals may be influenced by input rounding.
Apple’s share of the premium segment climbed to 65% from 63%. Sales of premium units grew 9%, driven primarily by the standard iPhone 17. Apple accounted for roughly 80% of the joint estimated growth in footprint.
The commercial impact was reflected in Apple’s most recent quarter. iPhone sales climbed 21.7% to $54.25 billion. Overall group revenue increased 16% to $109.4 billion. Gross margin was reported at 50.1%, boosted by roughly two percentage points from tariff refunds. Tim Cook described it as “our strongest June quarter ever.” Apple
Samsung maintained a 19% share in the premium segment and increased premium unit shipments by 3%. However, the MX and Networks divisions posted revenues of KRW33.2 trillion while recording an operating loss of KRW0.7 trillion, which Samsung attributed to higher component expenses. The Device Solutions segment delivered KRW89.2 trillion out of the groupwide operating profit total of KRW89.5 trillion.
Operational and market analysis
| Indicator | Apple | Samsung |
|---|---|---|
| H1 2026 premium share | 65% | 19% |
| H1 premium-unit growth | 9% | 3% |
| Latest quarterly group revenue | $109.4 billion | KRW171.5 trillion |
| Latest mobile disclosure | iPhone revenue $54.25 billion; +21.7% | MX and Networks revenue KRW33.2 trillion; KRW0.7 trillion loss |
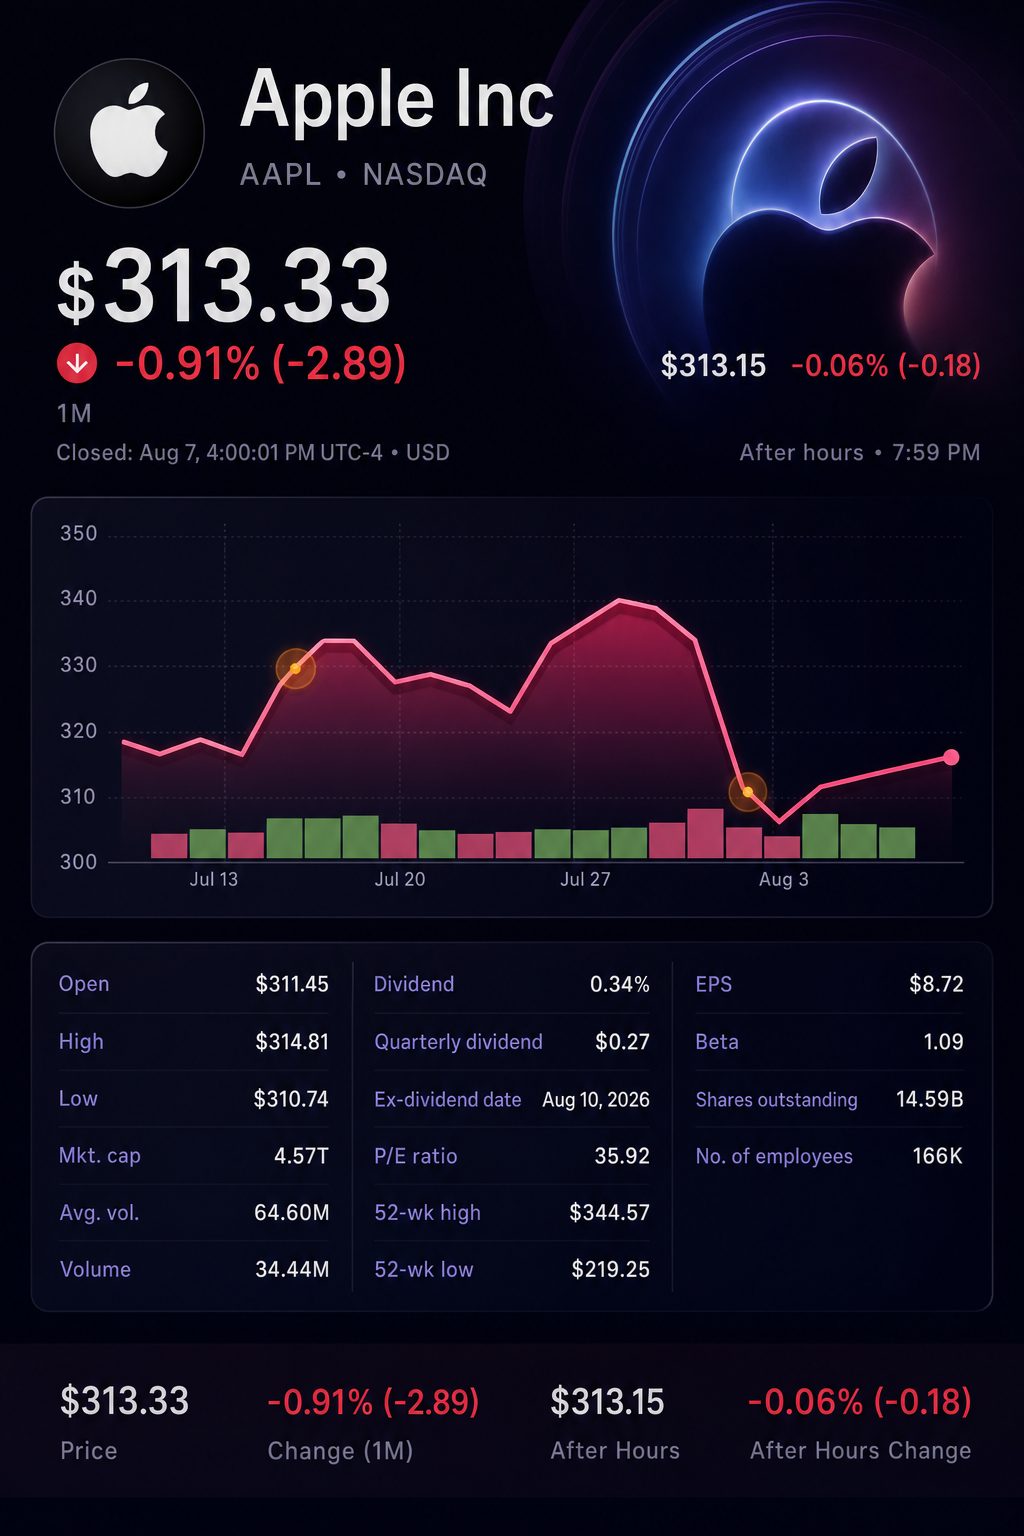
| Trailing P/E at August 7 | 35.92 times | 18.52 times |
| August 7 close | $313.33 | KRW231,000 |
| July 31–August 7 return | +1.4% | -12.0% |
Company segment data varies and cannot be directly compared. Weekly returns reflect close-to-close performance.
Premium sales at Oppo surged 69%, and Vivo posted a 20% increase, with both starting from a smaller base. Ongoing competition from Chinese brands continues to be the most significant long-term challenge to Apple’s position in the premium segment.
On Sunday, cash markets in both New York and Seoul were shut. Apple finished Friday at $313.33, marking a 1.4% increase since July 31. Samsung ended at KRW231,000, a decrease of 12.0%. The Nasdaq rose 5.19% last week, while Korean stocks continued to show significant volatility.
Analyst ratings
| FactSet measure | Apple | Samsung |
|---|---|---|
| Consensus | Overweight | Buy |
| Buy ratings | 24 | 33 |
| Overweight ratings | 8 | 5 |
| Hold ratings | 15 | 2 |
| Underweight and Sell | 4 | 0 |
| Average price target | $328.01 | KRW485,303 |
| August 7 close | $313.33 | KRW231,000 |
| Implied average-target upside | 4.7% | 110.1% |
All targets refer to local currencies. International quotes could reflect delays. Implied upside represents a mathematical calculation and should not be considered a prediction.
The recommendations indicate contrasting valuation scenarios. The consensus price target for Apple suggests only modest potential gains. By contrast, Samsung’s target is much higher, though recent losses in Korea have widened the disparity. Reuters reported that the KOSPI traded 33% under its June high.
Focus turns to rates and execution next week, leaving handset data behind. U.S. July CPI is due Wednesday at 8:30 a.m. ET, with PPI set for Thursday. Economists surveyed by Reuters anticipate headline inflation of 3.4% and core inflation of 2.5%. Apple’s $0.27 dividend record date falls on Monday and will be paid Thursday.
Risks: Counterpoint’s data are initial estimates and are rounded. The $600 threshold may automatically include models that appear more expensive due to inflation. Apple’s growth outlook for the September quarter is below what Wall Street anticipates. Samsung’s mobile division loss highlights that holding a premium market share does not ensure profitability. An unexpectedly strong CPI reading could weigh on technology stocks with high valuations.
From a handset economics perspective, Apple provides a clearer outlook. The company commands a larger share of the premium segment and secured the majority of new market coverage. Samsung, meanwhile, is valued at a lower earnings multiple and appears to offer broader target upside. Its profits and share price, however, are mainly influenced by memory segment performance and movements in the Korean market.
Related articles: NASDAQ:AAPL