
NEW YORK, August 9, 2026, 10:04 EDT — U.S. markets finished trading for the day.
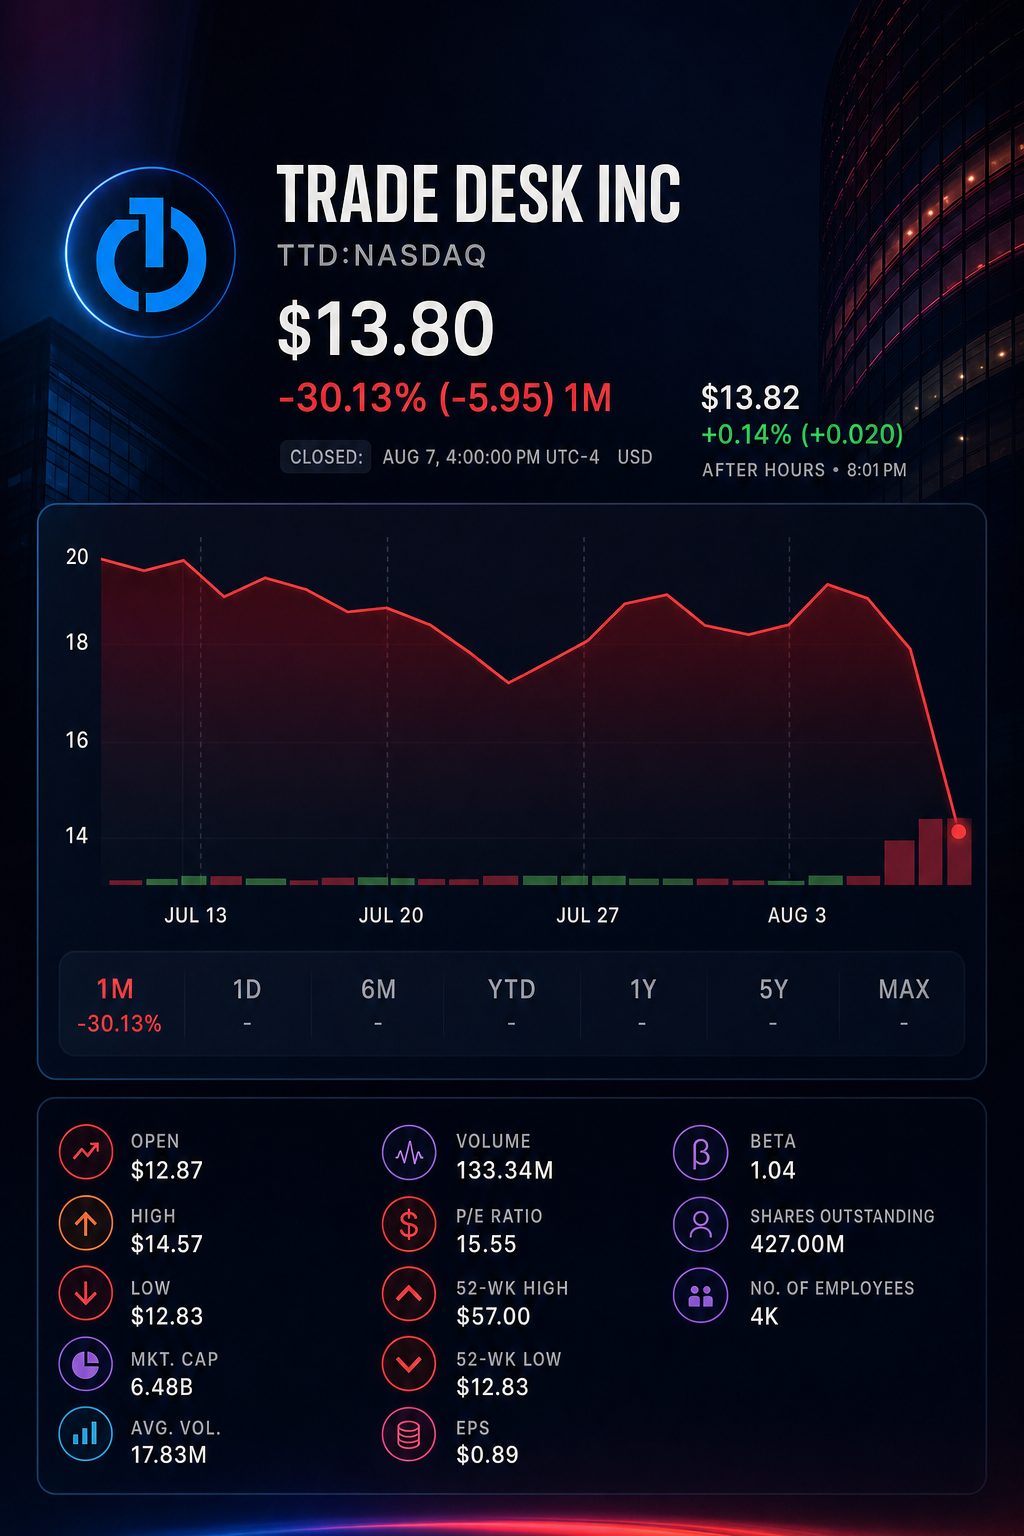
- The stock ended Friday at $13.80, a decline of 21.9%, making it the S&P 500’s biggest loser.
- Initial management forecasts indicate third-quarter revenue of no less than $650 million, while analysts’ projections had been around $806.5 million.
- If revenue reaches that floor, it will decrease by 12.1% compared to the previous year—closely aligning with the company’s 13% drop during the pandemic in 2020.
The selloff made an already soft quarter into a challenge for the company’s growth approach. Management’s minimum revenue outlook signals a decline almost matching the pandemic-era downturn.
The guidance outweighs the impact of Friday’s drop in headlines. It is 19.4% under the consensus before the report and 12.1% lower than the same quarter one year ago. The numbers are based on revenue reaching the minimum managers have set.
The reduction in margin is just as sharp. Forecasted adjusted EBITDA of roughly $160 million indicates a margin of 24.6%. This compares to a margin of 42.9% for 2025.
Revenue increased by 3% in the second quarter. However, adjusted EBITDA declined by 10.9%, with the margin shrinking by five percentage points.
Q2 performance update
| Metric | Q2 2026 actual | Q2 2025 | Year-on-year change | Pre-report consensus |
|---|---|---|---|---|
| Revenue | $715.1 million | $694.0 million | Up 3.0% | $752.6 million |
| Adjusted EBITDA | $241.3 million | $270.8 million | Down 10.9% | — |
| Adjusted EBITDA margin | 34% | 39% | Lower by 5 percentage points | — |
| Net income | $64 million | $90 million | Down roughly 29% | — |
| Non-GAAP diluted EPS | $0.34 | $0.41 | Down 17.1% | — |
Sources: figures disclosed in company reports and post-release analyst consensus. Calculations are based on released data.
Chief Executive Jeff Green stated the quarter “did not meet the standard we set for ourselves.” He added that management is focused on improving execution and enhancing the platform. The Trade Desk
Analysts at Evercore ISI NYSE:EVR, led by Mark Mahaney, took a stricter stance, suggesting the miss could point to “significant take-rate resets” or “very significant share losses.” They also highlighted possible effects from AI on the open web. Barron’s
The third-quarter adjustment is more significant than just a deceleration in growth. At its minimum, EBITDA would be about 50% lower compared to the previous year.
What the initial Q3 forecast suggests
| Metric | Q3 2026 management estimate | Q3 2025 actual | Pre-report consensus | Implied change |
|---|---|---|---|---|
| Revenue | Minimum $650 million | $739.4 million | $806.5 million | -12.1% year on year |
| Revenue versus consensus | $650 million minimum | — | $806.5 million | -19.4% |
| Adjusted EBITDA | Approximately $160 million | $317.5 million | — | -49.6% year on year |
| Adjusted EBITDA margin | 24.6% at minimum revenue | 42.9% | — | -18.3 percentage points |
Sources: company guidance, Q3 2025 results, and analyst consensus reports. Guidance figures are preliminary; all percentage calculations are based on the $650 million minimum.
The most recent parallel can be drawn to the second quarter of 2020, when revenue dropped by 13% as advertisers halted spending amid the pandemic. The current baseline suggests a similar decrease, though leading advertising platforms are still reporting growth.
The most recent reporting season shows this contrast clearly. AppLovin NASDAQ:APP, Meta Platforms NASDAQ:META, Amazon.com NASDAQ:AMZN, and Alphabet NASDAQ:GOOGL each posted double-digit growth figures in advertising or platform revenue.
Recent comparison of advertising-platform expansion
| Company | Relevant Q2 metric | Year-on-year growth |
|---|---|---|
| The Trade Desk | Total revenue | 3% |
| AppLovin NASDAQ:APP | Total revenue | 53% |
| Meta Platforms NASDAQ:META | Advertising revenue | 27% |
| Amazon.com NASDAQ:AMZN | Advertising-services revenue | 26% |
| Alphabet NASDAQ:GOOGL | Google Search and other | 17% |
| Alphabet | YouTube ad revenue | 13% |
Business composition and accounting terms vary. Data is as reported by each company and illustrates trends rather than providing exact value equivalence.
The figures challenge a purely macroeconomic rationale. Advertising demand hasn’t declined consistently across the board. The difference highlights the impact of factors such as execution, pricing, and possible market-share pressure facing The Trade Desk.
Wall Street is still split on whether Friday’s downturn signifies sufficient losses. After the report, firms set targets between $11 and $20, compared to the closing price of $13.80.
Analyst recommendations following earnings reports
| Analyst | Latest recommendation | New target | Previous target | Implied return from $13.80 |
|---|---|---|---|---|
| DA Davidson | Neutral, cut from Buy | $16 | $29 | +15.9% |
| Needham | Buy, unchanged | $19 | $25 | +37.7% |
| Benchmark | Buy, unchanged | $20 | $30 | +44.9% |
| RBC Capital Markets NYSE:RY | Sector Perform, lowered from Outperform | $15 | $33 | +8.7% |
| Citigroup NYSE:C | Sell, cut from Neutral | $11 | $21 | -20.3% |
| Wells Fargo NYSE:WFC | Equal Weight, unchanged | $12 | $20 | -13.0% |
Targets were disclosed following the publication of quarterly results. Implied returns are based on the $13.80 share price from Friday.
The balance sheet offers a degree of protection. As of June, cash and short-term investments stood at approximately $1.49 billion, representing about 23% of the $6.49 billion market value recorded on Friday.
The company repurchased $78 million worth of shares in the second quarter. There is still $269 million available in approved buyback funds. While this buffer enables further repurchases, it does not offset a sustained decline in revenue.
The broader market shifted the other way last week. The Nasdaq rose 5.19%, with the S&P 500 up 3.58%. The Trade Desk was the biggest loser on the benchmark by the close on Friday.
The upcoming key macroeconomic reports include July CPI due Wednesday, August 12, followed by PPI on Thursday and retail sales on Friday. Economists project a headline CPI rise of 3.4%, with core inflation at 2.5%. The data could influence advertising expenditure as well as valuations for growth stocks.
Risks are balanced in both directions. Revenue may surpass the cautious baseline if brand investment and connected TV performance pick up. Additional pricing headwinds or market share declines could see $650 million become a baseline, not just a low point.
Valuation is no longer the key proof point. Investors now require Q3 revenue that is significantly above the minimum and clear signs of margin stabilization. Shares will continue to move primarily based on execution until these conditions are met.
Related articles: NASDAQ:TTD