
NEW YORK, August 8, 2026, 09:09 EDT — U.S. markets finished the session closed.
- Shares ended Friday at $13.80, marking a decline of 21.9% for the day and 23.5% over the week.
- The third-quarter revenue minimum of $650 million represents a 12.0% decrease year-on-year and stands 19.4% under the previous consensus forecast.
- Customer retention remained over 95%, while revenue growth for the second quarter eased to 3%.
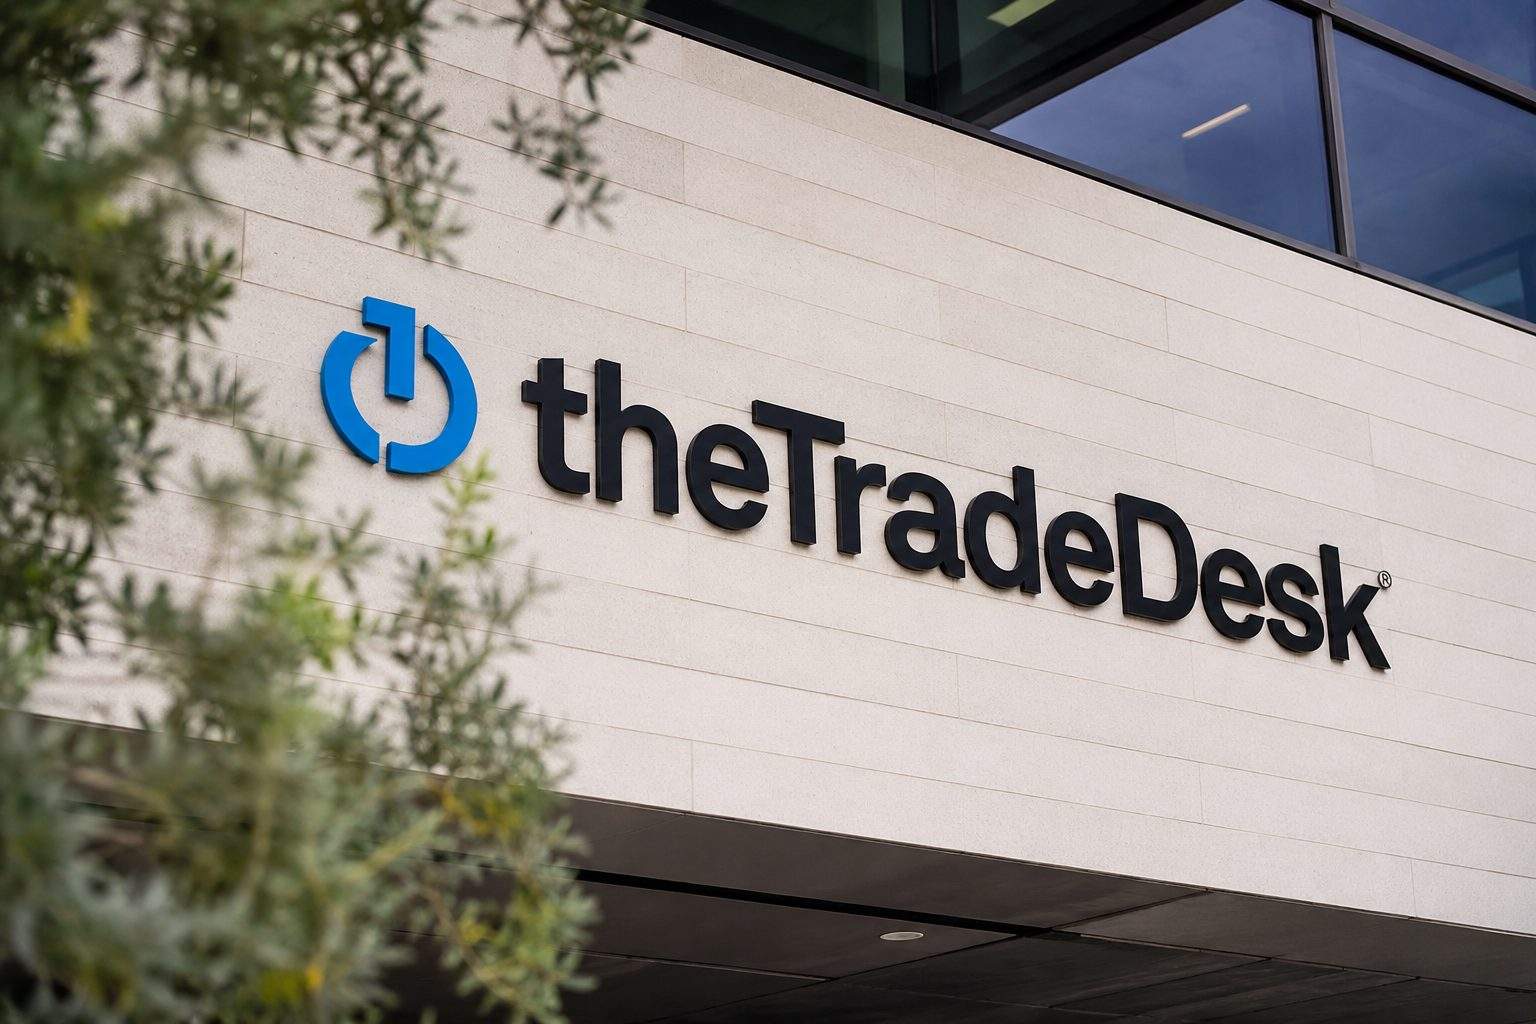
The Trade Desk dropped 21.9% on Friday after reporting quarterly revenue that fell short of analyst forecasts. The company’s third-quarter projection also lagged well below Wall Street estimates. The stock’s plunge wiped out around $1.8 billion in market capitalization, marking it as the S&P 500’s biggest decliner and setting its lowest finish since January 2019.
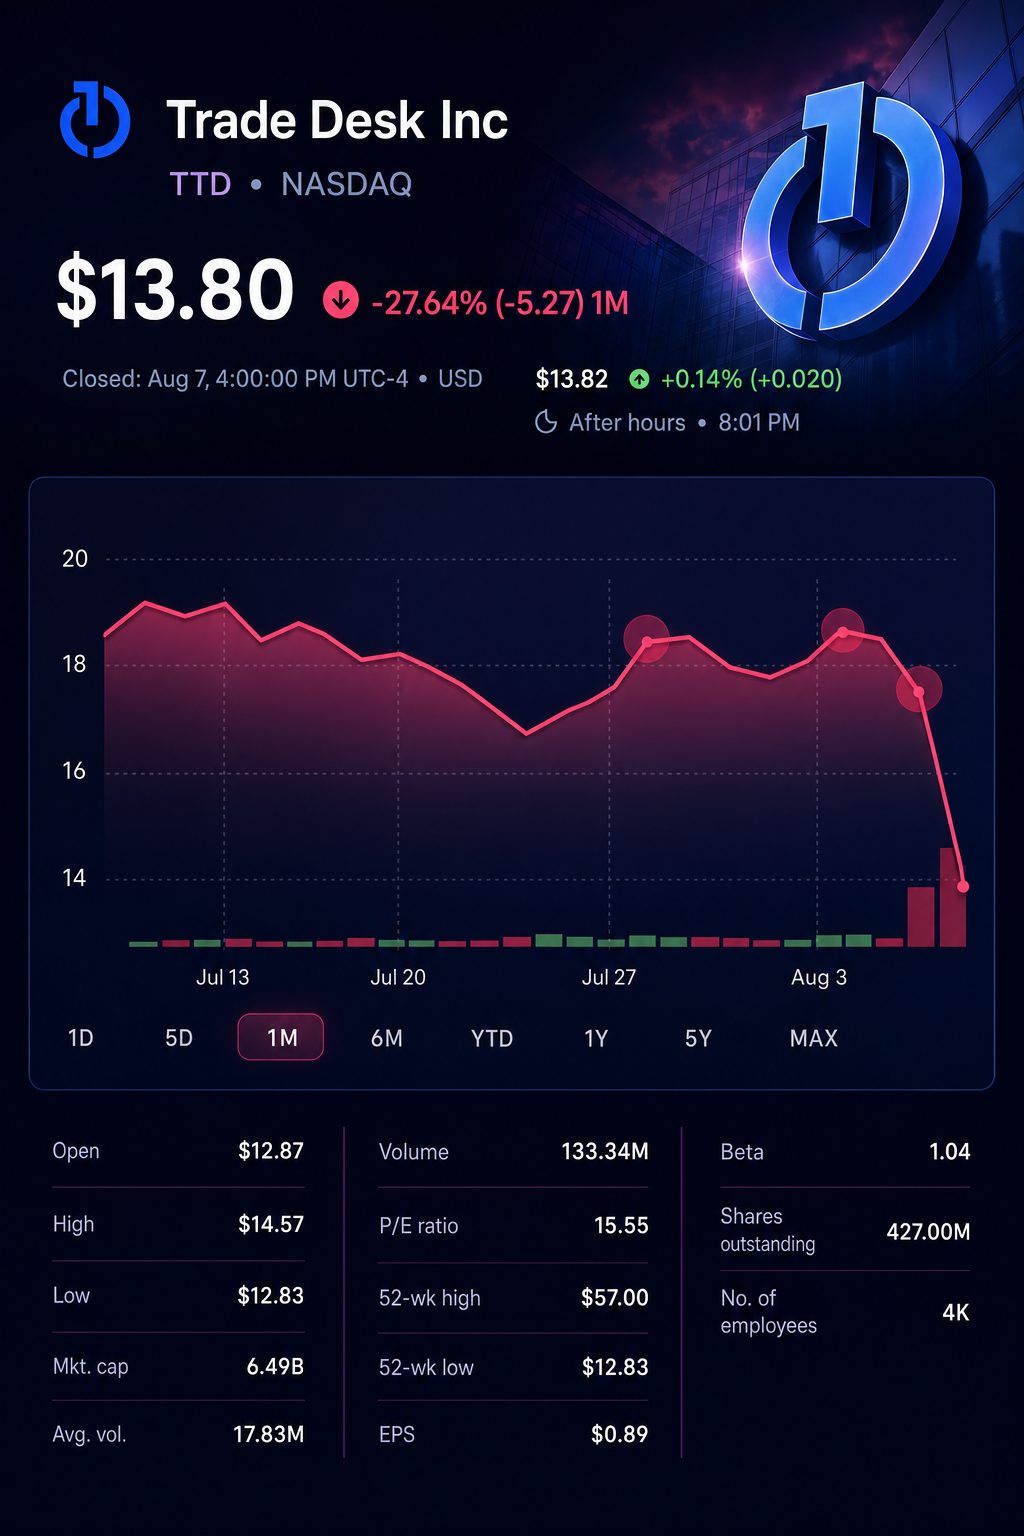
The main issue goes beyond losing customers. Retention held steady at over 95% for more than ten years. However, the lower end of guidance signals an unusual decline in revenue.
This mix indicates softer expenditure within retained accounts. It also prompts concerns over pricing strategies, media allocation and delivery. Securing clients is not the sole measure of success.
The S&P 500 climbed 3.58% last week and the Nasdaq added 5.19%, but The Trade Desk plunged 23.5% as the rest of the market strengthened.
| Asset | Friday close | Friday move |
|---|---|---|
| The Trade Desk NASDAQ:TTD | $13.80 | down 21.9% |
| AppLovin NASDAQ:APP | $346.80 | up 3.3% |
| Magnite (NASDAQ:MGNI) | $24.72 | rose 1.6% |
| S&P 500 | 7,757.64 | increased 0.62% |
| Nasdaq Composite | 26,690.62 | advanced 1.30% |
AppLovin and Magnite each closed up on Friday, suggesting a widespread ad-tech selloff does not fully account for the move.
Revenue for the second quarter increased by 3% to $715.1 million, falling short of the company’s lower guidance limit of $750 million by 4.7%. The figure also came in 5.0% below the consensus forecast of $752.6 million.
| Metric, $ millions except margins | Q2 2026, unaudited | Q2 2025 | Company floor or consensus | Variance, calculated |
|---|---|---|---|---|
| Revenue | $715.1 | $694.0 | $750.0 / $752.6 | -4.7% / -5.0% |
| Adjusted EBITDA | $241.3 | $270.8 | About $260.0 | -7.2% / -10.9% from previous year |
| Adjusted EBITDA margin | 34% | 39% | — | down 5 percentage points |
| GAAP net income | $64.4 | $90.1 | — | -28.6% from a year ago |
Rising costs weighed on slight gains. Operating expenses climbed 6.3%, about double the pace of revenue growth. Platform-operations costs increased by 22% amid greater spending on infrastructure.
Chief Executive Jeff Green acknowledged partial responsibility. “We didn’t execute as well as we could have,” he said. Roughly a quarter of business comes from advertisers in consumer goods and autos. Investing.com
The third-quarter forecast brought the biggest surprise. Projected revenue of no less than $650 million is 19.4% under the earlier consensus estimate. Adjusted EBITDA, expected at approximately $160 million, would represent an almost 50% decline from the same period last year.
| Metric, $ millions except margins | Q3 2026 guide or estimate | Q3 2025 | Prior consensus | Implied change, calculated |
|---|---|---|---|---|
| Revenue | No less than $650 | $739 | $806.5 | -12.0% year on year; -19.4% versus consensus |
| Adjusted EBITDA | Roughly $160 | $317 | — | -49.5% year on year |
| Adjusted EBITDA margin | 24.6% at minimum revenue | 43.0% | — | -18.4 percentage points |
Revenue at the lower end would decrease by 12.0% compared to Q3 2025. Raymond James noted this is the first annual drop not related to the pandemic. In the second quarter of 2020, revenue declined 13% because of the pandemic.
The retained-client figures serve as a counterbalance. Joint business plans climbed to 217, marking an increase of 38%. Revenue from these clients expanded at six times the rate of overall company sales.
Double-digit growth persisted for the majority of top-100 accounts, indicating that any softness is likely limited to a handful of larger budgets. The key indicator of a rebound is deeper spending, rather than just client retention.
The balance sheet helps contain financial pressure but does not assess risk. Cash and short-term investments amounted to $1.49 billion, representing roughly 23% of the company’s market capitalization as of Friday.
The value drop on Friday was close to seven times the $269 million left for buybacks. While buybacks might help buoy the stock, they do not address the lowered revenue outlook.
Wall Street made a wide adjustment on Friday. New projections now range from $11 to $20, surrounding where shares finished the session.
| Firm | Analyst | Recommendation action | New target | Target versus $13.80, calculated |
|---|---|---|---|---|
| Raymond James Financial NYSE:RJF | Andrew Marok | Downgraded to Underperform from Market Perform | — | — |
| Truist Financial NYSE:TFC | Youssef Squali | Lowered to Hold from Buy | $16 | +15.9% |
| Susquehanna | Shyam Patil | Shifted to Neutral from Positive | $14 | +1.4% |
| Evercore NYSE:EVR | Mark Mahaney | Dropped to In Line from Outperform | $13 | -5.8% |
| Citigroup NYSE:C | Ygal Arounian | Cut to Sell from Neutral | $11 | -20.3% |
| Benchmark | Mark Zgutowicz | Buy rating reaffirmed | $20 | +44.9% |
Raymond James analyst Andrew Marok pointed to demand for “lower-cost media.” Truist’s Youssef Squali noted that a recovery could span several quarters. Barron’s
The focus turns from earnings to macroeconomic data next week. July CPI figures are set for release on August 12, PPI on August 13, and retail sales on August 14. Analysts expect headline inflation at 3.4% and core inflation at 2.5%.
Risks: Management does not expect significant macro recovery and maintains that visibility remains low. Additional reductions could result from more affordable media, shifts in pricing, or postponed execution. Conversely, stronger CTV growth or a renewed increase in brand spending could support improved outcomes.
Related articles: NASDAQ:TTD