$27.28
−$3.24 · −10.62%
186,000 shares before hours
PALO ALTO, August 27, 2026, 06:49 EDT — HP shares dropped 10.6% in premarket trade after the company reported that global PC shipments declined 16%, erasing $3 billion from its market value.
| Metric | Result | Reference |
|---|---|---|
| Revenue | $15.7B | +12.5% YoY |
| Adjusted EPS | $0.83 | $0.69 LSEG |
| Personal Systems revenue | $11.8B | +18% YoY |
| PC units | −16% | Consumer −19% |
| Personal Systems margin | 4.6% | 5.2% in Q2 |
| Printing revenue | $3.9B | −2% YoY |
| Quarterly free cash flow | $1.6B | $0.8B in Q2 |
Bars are scaled for visual comparison, not to a common unit. Basis points measure one-hundredth of a percentage point.
The stated 74-cent midpoint includes an estimated eight-cent tariff refund. Removing it leaves 66 cents, one cent below consensus.
| Premarket equity value | ≈$24.95B |
| Close P/E | 11.65× |
| Dividend yield at close | 3.93% |
| Average analyst target | $27.88 |
| Fresh targets, Aug. 27 | Goldman $22 · UBS $28 |
| Consensus | Hold |
Premarket equity value equals $27.28 multiplied by 914.52M shares. Analyst data updated Aug. 27 at 06:45 EDT.
Downside mechanism: memory and storage inflation outpaces repricing, pushing Personal Systems margin below 4.6%.
Upside mechanism: premium and AI-PC mix supports price while shipment declines moderate.
Invalidation check: strip tariff refunds from EPS before comparing core execution with consensus.
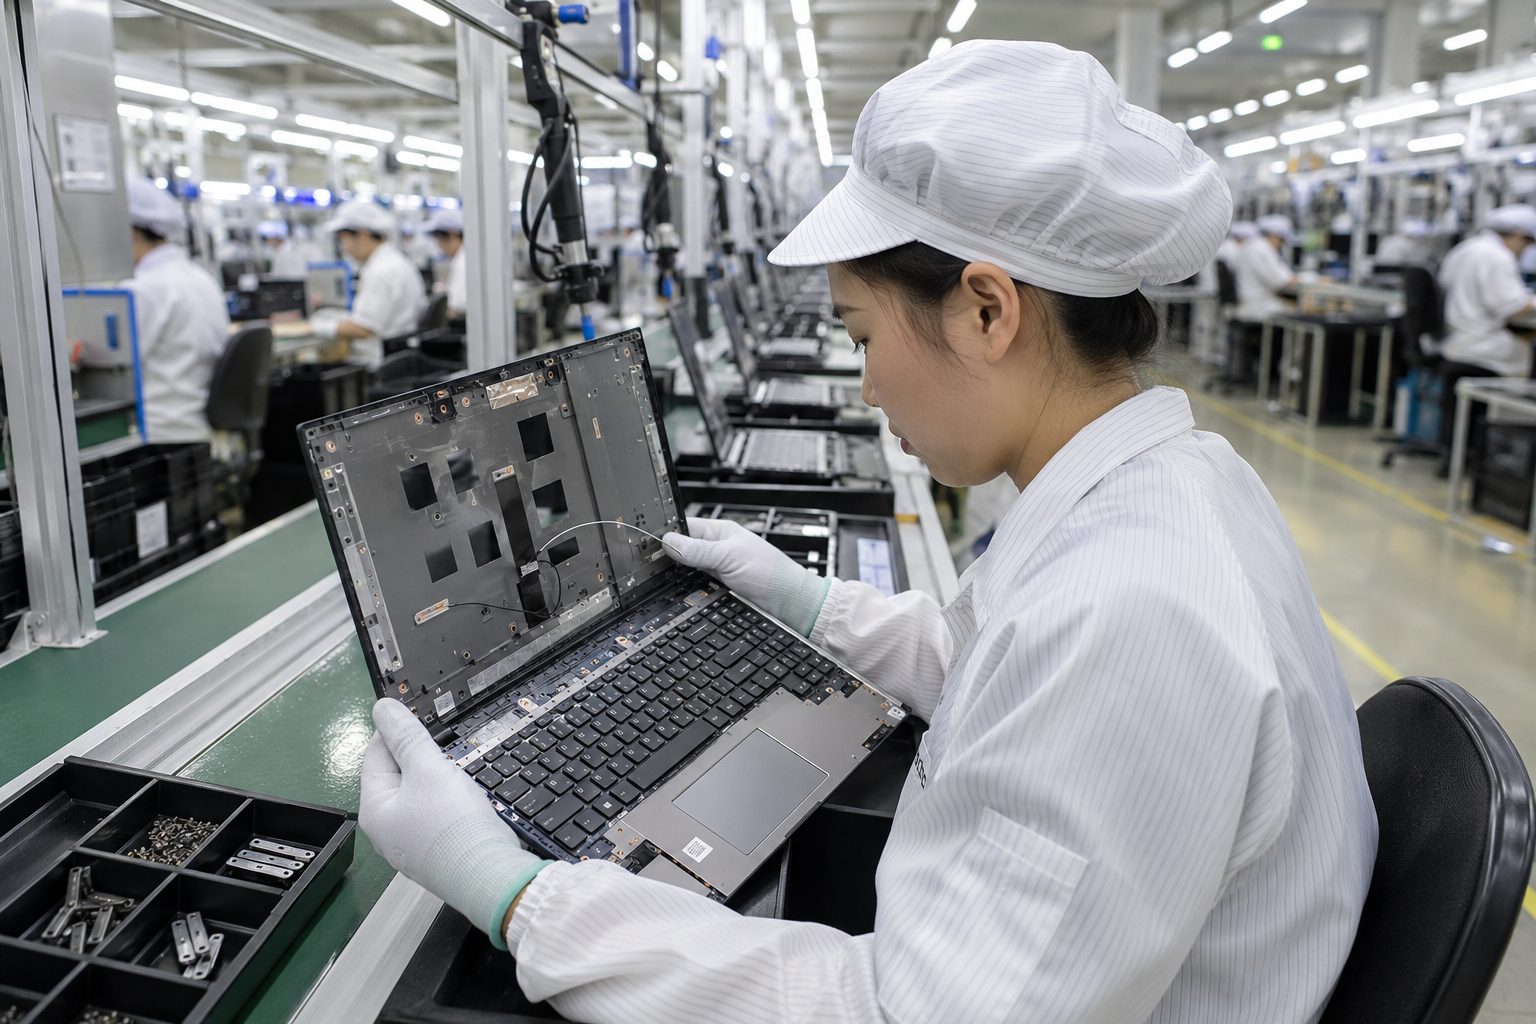
The divergence matters. A simple revenue-to-units calculation implies roughly 40% higher Personal Systems revenue per unit. Pricing and premium mix did the heavy lifting while underlying unit demand contracted.
Regular close: 16:00:02 EDT. After-hours quote: 17:02:21 EDT.
| Metric | Result / guide | Reference |
|---|---|---|
| Q3 revenue | $15.68B | $14.44B est. |
| Q3 adjusted EPS | $0.83 | $0.66 est. |
| Q3 net income | $661M | $763M year ago |
| FY adjusted EPS | $3.19–$3.29 | $2.90–$3.10 prior |
| FY free cash flow | $3.0–$3.2B | $2.8–$3.0B prior |
| Q4 adjusted EPS | $0.69–$0.79 | $0.67 consensus |
Printing’s 2% decline is important because the segment has carried far higher margins. In fiscal Q2, Personal Systems margin was 5.2%; Printing margin was 18.3%.
| Company | Aug. 26 close | Session move | Market cap | P/E |
|---|---|---|---|---|
| HP (HPQ) | $30.52 | +3.39% | $28.23B | 11.3× |
| Dell (DELL) | $463.82 | +2.77% | $304.27B | 37.0× |
| Apple (AAPL) | $313.45 | +1.16% | $4.61T | 36.0× |
| Logitech (LOGI) | $100.19 | +1.56% | $14.53B | 18.4× |
HP’s lower multiple prices in a structurally weaker mix and limited unit growth. At the $27.77 after-hours price, the $23.41 one-year analyst target implied 15.7% downside. The $3.1 billion free-cash-flow midpoint equaled roughly 12% of implied after-hours equity value.
Peer prices and valuation snapshot: August 26, 2026, approximately 16:45–16:50 EDT. HP after-hours valuation is an estimate using the closing share count.
Demand: Higher prices may suppress replacement units.
Margins: Memory inflation may arrive before pricing catches up.
Mix: PC growth has lower margins than Printing.
Quality: Tariff refunds are nonrecurring.
Sentiment: The analyst target remains below the traded price.
HP fiscal Q3 earnings call — August 26, 2026, 17:30 EDT. The market needs a bridge from strong revenue to sustainable unit growth and margins. Guidance on memory supply, pricing, Printing and refund-adjusted earnings will set the next move.
Sources: Reuters · The Wall Street Journal · Yahoo Finance · HP investor relations



![US Stock Market Today 08/28/2026 [UPDATE: 03:04 EDT] [Marvell Stays Near Overnight Low as Premarket Handoff Nears]](https://ts2.tech/wp-content/uploads/2026/08/US-market-dashboard-2026-08-28-0300-480x384.jpg "US Stock Market Today 08/28/2026 [UPDATE: 03:04 EDT] [Marvell Stays Near Overnight Low as Premarket Handoff Nears]")