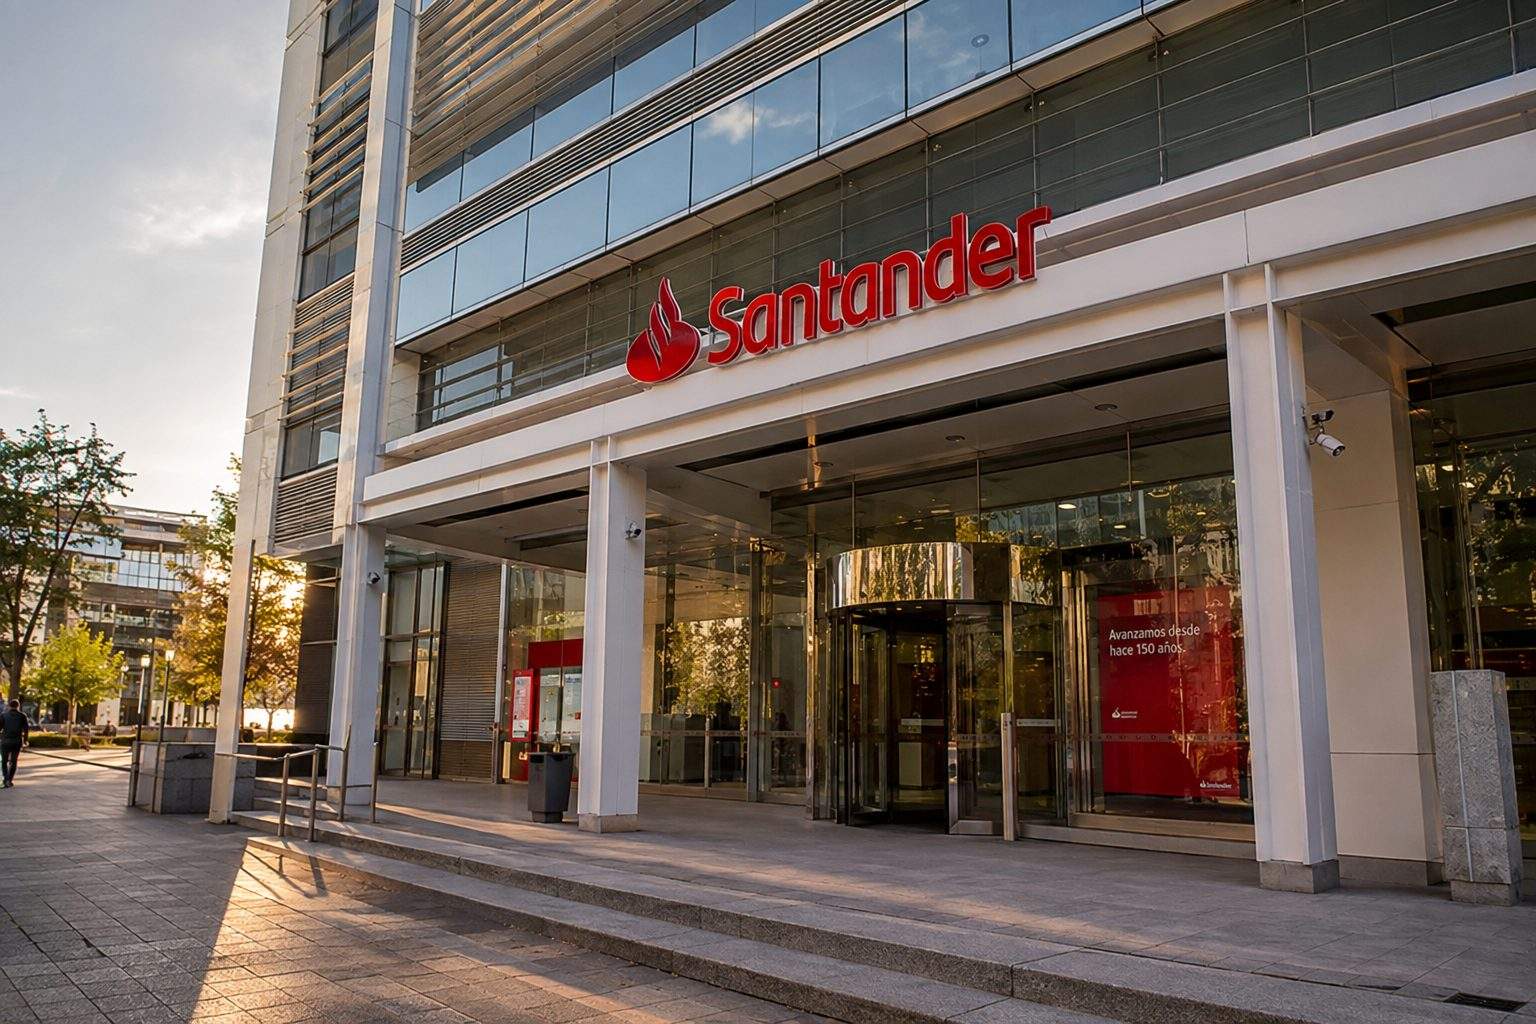

Holders of Webster Financial Corporation shares saw an increase of roughly $1.16 per previous share after the bank’s last trade. The profit was realized via Banco Santander, and not through Webster itself. Santander ended Friday at $14.59, having risen 2.67%.
| Metric | Q2 2026 | Q2 2025 | Direction |
|---|---|---|---|
| Diluted EPS | $1.56 | $1.52 | +2.6% |
| Net interest margin | 3.26% | 3.44% | −18 bps |
| Credit-loss provision | $31.5M | $46.5M | −32.3% |
| Nonperforming-loan ratio | 0.74% | 1.00% | −26 bps |
| Past-due loans | $117.3M | $54.7M | +114.3% |
| Analyst | Rating | Target | Date |
|---|---|---|---|
| Barclays | Hold | $78.00 | Aug. 3 |
| RBC Capital | Hold | $76.00 | Jul. 22 |
| Keefe, Bruyette & Woods | Buy | $77.50 | May 1 |
| Truist | Hold | $72.00 | Apr. 8 |
| UBS | Hold | $69.00 | Apr. 7 |
WBS no longer trades. The last quote belongs to August 19; former holders now have $48.75 cash and 2.0548 Santander ADSs for each Webster share.
Closing price line and volume bars. No price exists after August 19.
Marked at Santander’s August 21 NYSE close, 16:00 EDT.
The cash is fixed. The equity value now moves with Santander, so there is no continuing WBS spread to trade.
August 14 to August 21. WBS ends at its August 19 final close.
Santander’s decline was milder than this regional-bank comparison. That is context, not proof the merger caused relative strength.
| Revenue | $740.0M |
| Adjusted EPS | $1.60 |
| Deposits | $70.3B · +6% YoY |
| Loans | $57.9B · +7.8% YoY |
| Net interest margin | 3.26% · −18 bp YoY |
| CET1 ratio | 11.69% preliminary |
| Nonperforming-loan ratio | 0.74% · down from 1.00% |
Market data checked Aug. 20, 2026 · 10:50 EDT · WBS final close Aug. 19
The remaining value now moves with Santander’s U.S.-listed ADS.
The 15× spike reflects conversion and index/arbitrage mechanics at the end of WBS trading.
| Metric | Target |
|---|---|
| Annual cost savings | $800M |
| U.S. return on tangible equity | ~18% |
| Group EPS accretion | 7%–8% |
| Return on invested capital | ~15% |
| U.S. efficiency ratio | <40% |
| Q2 2026 metric | Result |
|---|---|
| Revenue | $740M |
| Deposits | $70.3B |
| Loans and leases | $57.9B |
| Net interest margin | 3.26% |
| Adjusted EPS | $1.60 |
| Source | View / target |
|---|---|
| Barclays | Hold · $78 |
| RBC Capital | Hold · $76 |
| KBW | Buy · $77.50 |
| 16-analyst consensus | Hold · $74.25 |
Before close Deal spread, regulatory timing and WBS fundamentals.
After close Santander integration, deposit retention, credit costs and synergy delivery.
Key risk: cost removal could disrupt customers or deposits, while weaker credit quality may delay the planned earnings lift.
Sources: Santander transaction and approval releases; Webster Q2 2026 filing and results; Yahoo Finance market data; analyst snapshots from MarketBeat and Investing.com. Values rounded. Implied deal value = $48.75 + 2.0548 × SAN ADS price.
The stock leg was worth $29.12 at Santander’s Wednesday close.
Today’s highest-ranked model selections.
The catalysts most likely to move markets.
A large surprise can reset expectations for household spending and near-term growth, with read-through to Treasuries, USD and cyclical stocks.
Housing remains highly rate-sensitive; the print can move homebuilders, mortgage-sensitive names and the long end of the Treasury curve.
Guidance can influence software multiples and sentiment around U.S. small-business activity.