WBS final close
$77.57
Aug. 19 · delisted Aug. 20
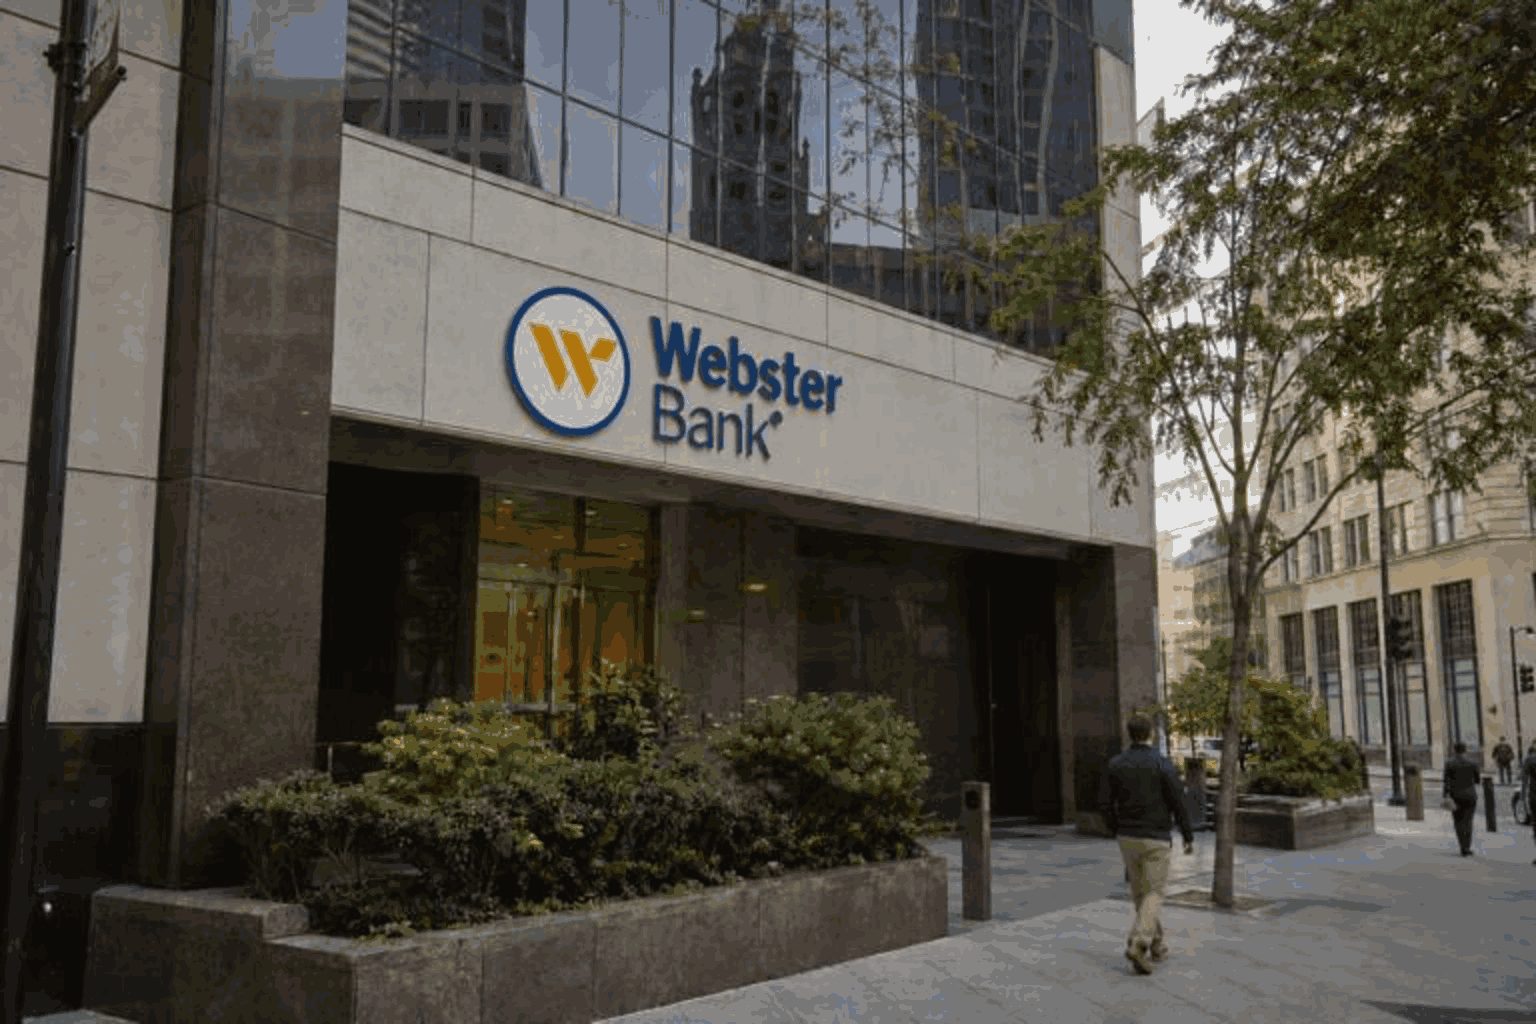
Webster Financial’s obsolete WBS ticker still led Yahoo Finance’s indexed Most Active list on Friday. The bank itself no longer trades. Santander completed its acquisition on August 20 and requested WBS’s delisting before that session opened.
| Metric | Webster Q2 2026 | Combined / target | Investor read-through |
|---|---|---|---|
| Deposits | $70.3B | $172B combined | Cheaper funding is the strategic asset |
| Loans | $57.9B | $185B combined | Scale rises; underwriting discipline matters |
| Net interest margin | 3.26% | Not yet disclosed | Rate sensitivity remains material |
| CET1 | 11.69% | Group-managed | Capital buffer enters SAN framework |
| Annual cost savings | — | $800M by integration | 6.6% of stated purchase price |
| U.S. RoTE | 16.67% tangible common return | ≈18% target for 2028 | Execution benchmark for SAN |
WBS trading was suspended before the Aug. 20 open. Yahoo’s indexed activity ranking can still surface the final transaction-volume record. That is not a new WBS price signal.
WBS: delistedSAN: live NYSE ADSCash: fixed $48.75Synergy timing, customer retention, technology conversion and branch consolidation can all change realized returns.
Higher funding costs or weaker credit quality could offset cost savings. Santander’s 7%–8% EPS-accretion target remains a 2028 objective, not a completed result.
| Metric | Q2 2026 | Q2 2025 | Direction |
|---|---|---|---|
| Diluted EPS | $1.56 | $1.52 | +2.6% |
| Net interest margin | 3.26% | 3.44% | −18 bps |
| Credit-loss provision | $31.5M | $46.5M | −32.3% |
| Nonperforming-loan ratio | 0.74% | 1.00% | −26 bps |
| Past-due loans | $117.3M | $54.7M | +114.3% |
| Analyst | Rating | Target | Date |
|---|---|---|---|
| Barclays | Hold | $78.00 | Aug. 3 |
| RBC Capital | Hold | $76.00 | Jul. 22 |
| Keefe, Bruyette & Woods | Buy | $77.50 | May 1 |
| Truist | Hold | $72.00 | Apr. 8 |
| UBS | Hold | $69.00 | Apr. 7 |
| Revenue | $740.0M |
| Adjusted EPS | $1.60 |
| Deposits | $70.3B · +6% YoY |
| Loans | $57.9B · +7.8% YoY |
| Net interest margin | 3.26% · −18 bp YoY |
| CET1 ratio | 11.69% preliminary |
| Nonperforming-loan ratio | 0.74% · down from 1.00% |
Market data checked Aug. 20, 2026 · 10:50 EDT · WBS final close Aug. 19
The remaining value now moves with Santander’s U.S.-listed ADS.
The 15× spike reflects conversion and index/arbitrage mechanics at the end of WBS trading.
| Metric | Target |
|---|---|
| Annual cost savings | $800M |
| U.S. return on tangible equity | ~18% |
| Group EPS accretion | 7%–8% |
| Return on invested capital | ~15% |
| U.S. efficiency ratio | <40% |
| Q2 2026 metric | Result |
|---|---|
| Revenue | $740M |
| Deposits | $70.3B |
| Loans and leases | $57.9B |
| Net interest margin | 3.26% |
| Adjusted EPS | $1.60 |
| Source | View / target |
|---|---|
| Barclays | Hold · $78 |
| RBC Capital | Hold · $76 |
| KBW | Buy · $77.50 |
| 16-analyst consensus | Hold · $74.25 |
Before close Deal spread, regulatory timing and WBS fundamentals.
After close Santander integration, deposit retention, credit costs and synergy delivery.
Key risk: cost removal could disrupt customers or deposits, while weaker credit quality may delay the planned earnings lift.
Sources: Santander transaction and approval releases; Webster Q2 2026 filing and results; Yahoo Finance market data; analyst snapshots from MarketBeat and Investing.com. Values rounded. Implied deal value = $48.75 + 2.0548 × SAN ADS price.
The stock leg was worth $29.12 at Santander’s Wednesday close.
The ADR’s implied value drop of $5.0 billion amounted to almost 58 times the settlement reached by all six banks. Santander’s specific share was not made public and is less than the combined amount.
Adjusted closing prices from August 11 to August 18, 2026. The last trading session saw a decline accompanied by a surge in trading volume.
Scale comparison in U.S. dollars, using the same currency basis.
Comparison reflects the upper bound only. Santander's portion of the settlement remains confidential; the movement in the market cannot be attributed to a single factor.
U.S. ADR movements for August 18, 2026, captured at 16:04:33 EDT.
Santander trailed all peers by no less than 2.0 percentage points. The bank's 20-day volume multiple stood at 3.94×, compared to every peer's figure of under 0.85×.
Published July 2026; where available, growth rates shown in constant euros.
S&P Global's consensus from 20 analysts on Madrid shares.
Madrid settled at €12.454 as of 17:44:00 CEST on August 18, 2026.