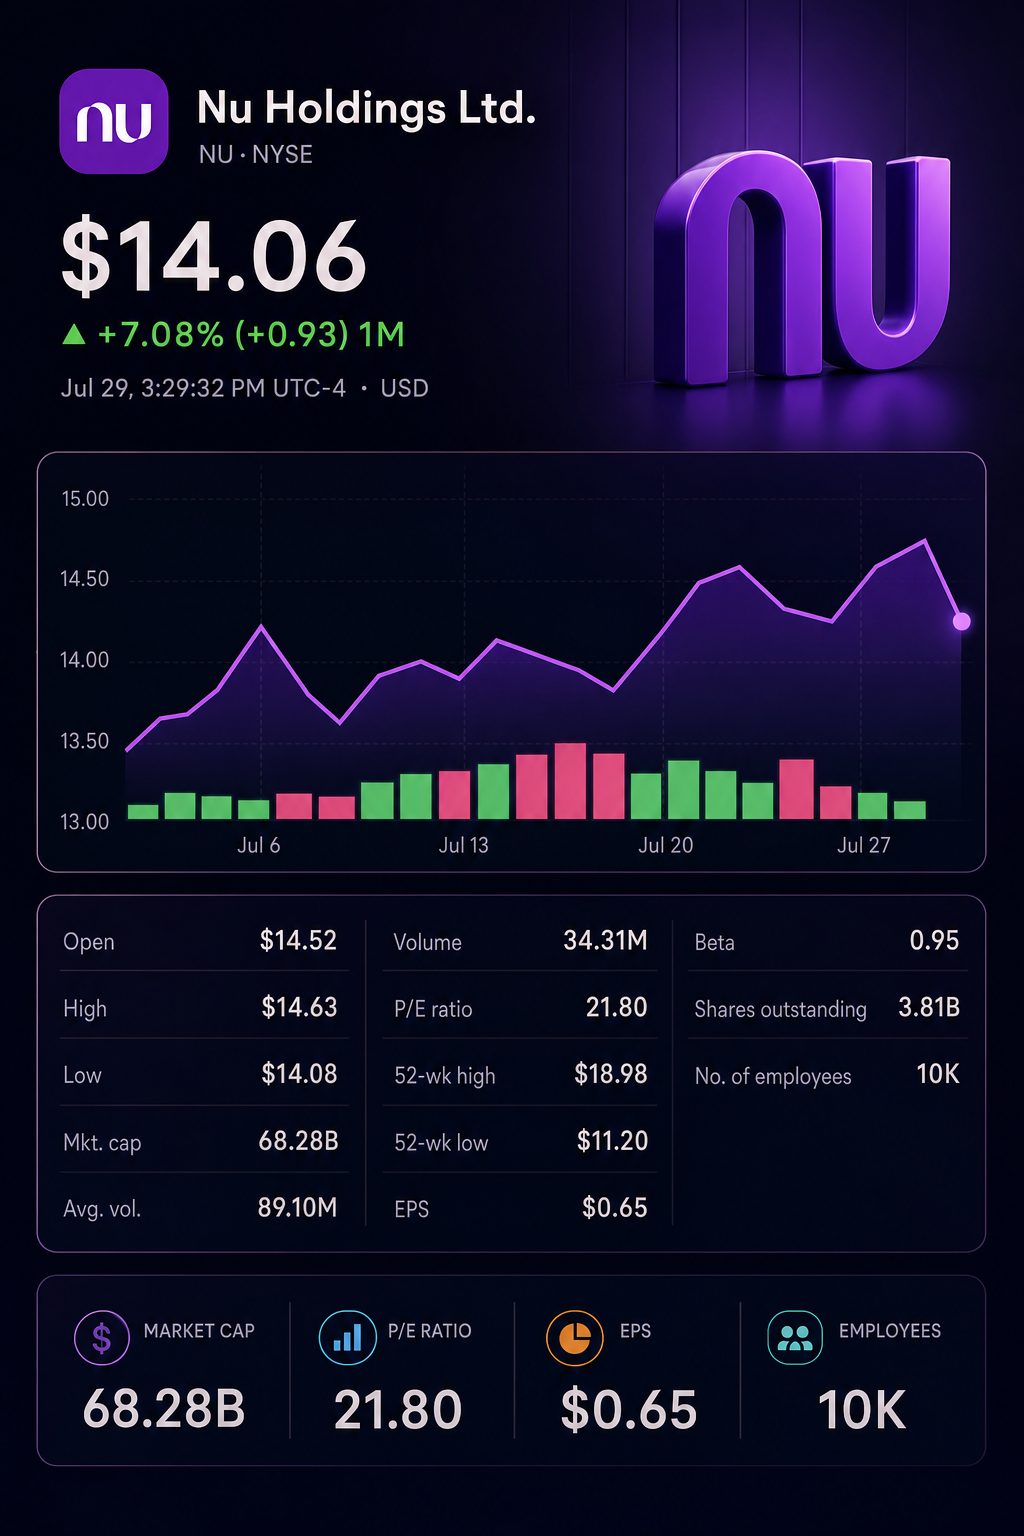
Nu shares declined 3.1% to $14.23 in afternoon trading on Wednesday. Intraday data is still subject to change.
Croma’s new card package eliminates its R$39 monthly charge for customers who spend at least R$4,000 each month.
Nu’s rewards expense for the first quarter jumped 95%, outpacing the 31% increase in card income.
Nu Holdings Ltd. NYSE:NU was down 3.1% at $14.23 on Wednesday afternoon. Price and volume data are provisional as U.S. markets continued trading.
Nubank’s July 28 introduction of Croma in Brazil triggered the decline. The product shifts investor focus from expanding the customer base to increasing wallet share and improving revenue quality. Nu’s Brazilian customer count already tops 115 million.
General purchases with Croma earn 0.8% cashback, while qualifying subscription transactions return 5% cashback. The offering further includes mobile connectivity, toll payment features, and investment bonuses.
The service charges a monthly fee of 39 Brazilian reais (R$39). Nu does not apply this fee to customers who spend R$4,000 per month or maintain R$30,000 in savings and investments.
“This is how we acknowledge and strengthen our bond with those who select and rely on Nubank,” said Tulio Oliveira, vice president for Croma and Ultravioleta. Nu International
A sample calculation highlights the possible magnitude. With one million users each paying full fees, yearly gross fees would reach R$468 million. This figure does not account for waivers, rewards, partner expenses or taxes. The calculation does not represent company guidance.
This group would account for under 1% of Nu’s customer base in Brazil. At the required spending level, annual card billings would reach R$48 billion. The estimate is based on each individual spending R$4,000 per month.
The waiver carries greater significance than the headline fee. It indicates Nu is encouraging Croma to focus its spending, deposits, and additional services within its platform.
The expense challenge has already emerged. In the first quarter, Nu’s filing reveals rewards costs increased at a much higher rate than card-related revenues.
Q1 card economics
2026
2025
Year-on-year change
Revenue from credit and prepaid cards
$486.2 million
$372.4 million
+30.6%
Reward costs
$38.4 million
$19.7 million
+95.0%
Rewards as portion of card revenue
7.9%
5.3%
+2.6 percentage points
Rewards expense increased at about three times the pace of card income. While this ratio serves merely as a proxy and not as an actual product margin, it highlights the economic hurdle Croma faces.
Nu posted average monthly revenue per active customer at approximately $16 during the first quarter. Its efficiency ratio dropped to 17.6%, compared with 19.9% a quarter earlier. The lower ratio provides Nu with investment capacity, though careful management is still required.
Credit indicators showed less positive movement. Early-stage delinquencies increased by 89 basis points to reach 5.0%. The risk-adjusted net interest margin declined to 9.5%, compared with 10.5% previously. The ratio of loans overdue by more than 90 days slipped to 6.5%.
Chief Executive David Vélez stated that Nu would “grow limits with resilience, not just speed.” Croma is now expected to meet the same measure. Nu International
The main business continued to generate solid profits. Net income for the first quarter increased by 41% to $871 million. Return on equity, annualized, hit 29%.
Nu underperformed other Brazilian fintech stocks on Wednesday. PagSeguro Digital Ltd. NYSE:PAGS rose 0.3%, while shares of StoneCo Ltd. NASDAQ:STNE slipped 1.1%. The iShares MSCI Brazil ETF (NYSEARCA:EWZ) dropped 0.7%.
U.S. markets showed a mixed performance during the broader session as the Federal Reserve kept its benchmark interest rate unchanged at 3.50%-3.75%. Three Fed officials dissented, backing a 25 basis-point hike.
Nu will announce its second-quarter earnings following market close on August 13. Investors are set to monitor active-customer revenue, reward expenses, card transaction volumes, and initial signs of delinquencies.
Risks persist. Higher rewards might drive increased spending but not deliver sufficient incremental revenue. If early delinquencies worsen, risk-adjusted margins may come under additional pressure.
The stock’s future direction may rely less on the growth of new accounts. Net economics per active customer has become more significant.
What is NU's current trading level, and what does the valuation indicate?
By 18:41 UTC, NU was trading at $14.23, a decline of $0.45, or 3.1%. The session saw a low of $14.09 and a high of $14.74, with volume at 30.0 million shares. At this price, market capitalization was close to $68.1 billion. Based on trailing earnings near $3.2 billion, the stock trades at roughly 21 times profit. WallStreetZen Meanwhile, the S&P 500 dropped around 1% in a risk-off market.
Does NU's first quarter performance support its current valuation?
Nu posted $4.97 billion in IFRS revenue, a 53% increase compared to the previous year. Net income totaled $871 million, up from $557 million. Diluted earnings per share came to $0.178, rising from $0.114. According to Nu’s managerial presentation, revenue measured at FX-neutral rates amounted to $5.3 billion. Return on equity reached 29%, while gross profit stood at $1.88 billion.
Does the pace of customer growth remain sufficient to sustain earnings?
Nu recorded an increase of roughly four million customers in the first quarter, bringing its global total to more than 135 million by March 2026. In Brazil, customer numbers topped 115 million, while Mexico crossed 15 million. Colombia neared five million, but Nu did not disclose any profit figures for individual countries. Monthly active user rate was steady at 83%, with ARPAC at around $16.
Is credit quality emerging as the primary risk?
The delinquency ratio for loans overdue between 15 and 90 days increased by 89 basis points, reaching 5.0%. Loans past due for more than 90 days declined by ten basis points, now standing at 6.5%. Credit-loss allowances grew to $1.79 billion, a 33% increase from the previous quarter. The risk-adjusted net interest margin slipped to 9.5% from 10.5%. Management attributed the changes to seasonality and deeper entry into higher-risk customer groups.
What is the remaining balance-sheet runway for Nu?
The credit portfolio rose 40% year on year to $37.2 billion. Deposits stood at $42.4 billion, up 22% over the same period. The loan-to-deposit ratio increased to 58.3%, compared with 49.1% in December. Deposits continue to surpass the credit portfolio by about $5.2 billion. Despite this, the pace of credit growth heightens the need for disciplined underwriting.
What makes Mexico more significant at this moment?
Mexico surpassed 15 million customers and achieved break-even in the first quarter. Starting August 6, Nu Mexico will operate as a bank. This comes after securing regulatory approval on July 10. Full banking status is expected to allow for broader product offerings and funding opportunities. Nu also reached an agreement to buy Banco Porto Real, pending approval in Brazil. According to Nu, the new Brazilian license does not require additional capital or liquidity.
Does the investment outlook benefit from the buyback and CFO transition?
Nu has approved a share buyback programme of up to $1 billion, set to run until June 3, 2027. At the current price of $14.23, full utilisation would retire around 70 million shares, representing about 1.4% of Nu’s most recent diluted share count. Rob Livingston, previously at Visa, took over as CFO on July 13. BofA lowered its price target to $10, pointing to worries over the CFO transition. Participation in the buyback is voluntary; real impact depends on execution rather than the headline figure.
What level of importance should investors place on United States expansion?
Nu has received conditional approval from the OCC to form a U.S. national bank. Full approval is pending, subject to meeting regulatory conditions. The company intends to lay the operational foundation in 2026. There is currently no reported United States revenue. This potential is part of a bullish scenario, not included in present base earnings.
What does Nu need to show when it reports second-quarter results?
Nu plans to announce its second-quarter earnings following the market close on August 13. Analyst forecasts suggest quarterly earnings per share will be close to $0.20, with consensus expectations for 2026 standing at roughly $0.84 per share. Investors are set to monitor ARPAC, profitability in Mexico, provisions, and delinquency figures. For results to be viewed as cleaner, the company needs to demonstrate stable late-stage delinquencies and stronger risk-adjusted margins.
What is the prediction for NU’s stock price over the next 12 months?
Analyst consensus averages $17.59 to $17.98, with price targets ranging from $10 up to $22. Based on the current $14.23, those averages suggest an upside potential of about 24% to 26%. A plausible base scenario stands between $16 and $18, assuming 2026 earnings approach $0.84. If credit trends improve, the optimistic scenario points to $20 to $22. In a negative scenario, with sharply higher provisions, estimates fall to $10 to $12. This broad range underscores genuine uncertainty, rather than precision.
Iwona Majkowska is a financial markets journalist at TS2.tech. She covers stocks, artificial intelligence and technology, with a focus on the stories moving U.S. and global markets. Before turning to financial journalism, she worked in equity research and financial analysis. She is a graduate of the Warsaw School of Economics. Follow Iwona Majkowska on Google News.
Surprising starts and permits data can impact homebuilders, mortgage-sensitive stocks, Treasury yields, and the dollar if results deviate significantly from consensus estimates.
#02
Home Depot Q2
The results and outlook provide key insights into housing turnover, renovation demand, professional customer activity, and U.S. discretionary spending.
#03
09:15 ET industrial production
A robust or disappointing factory or utilities report can shift expectations for economic growth, cyclical stocks, bond yields, and the Federal Reserve’s policy direction.