
Plug Power (NASDAQ:PLUG) shares fall as cash burn comes under scrutiny following Texas sale
31 July 2026

Plug Power (NASDAQ:PLUG) shares fall as cash burn comes under scrutiny following Texas sale

NEW YORK, July 31, 2026, 14:10 (EDT)

  • Plug Power shares were at $2.05, falling 1.9%, following a 10% rise on Thursday.
  • The Graham project has the potential to provide as much as $90.5 million in liquidity, representing 60% of operating cash used in the first quarter.
  • The implied maximum purchase price equates to roughly $466,000 for each megawatt, based on a calculation that factors in both land and 164 MW of interconnection capacity.

Shares of Plug Power declined 1.9% to $2.05 during afternoon trade. U.S. markets remained open. The drop came after a 10% jump on Thursday, which had snapped a six-day losing streak.
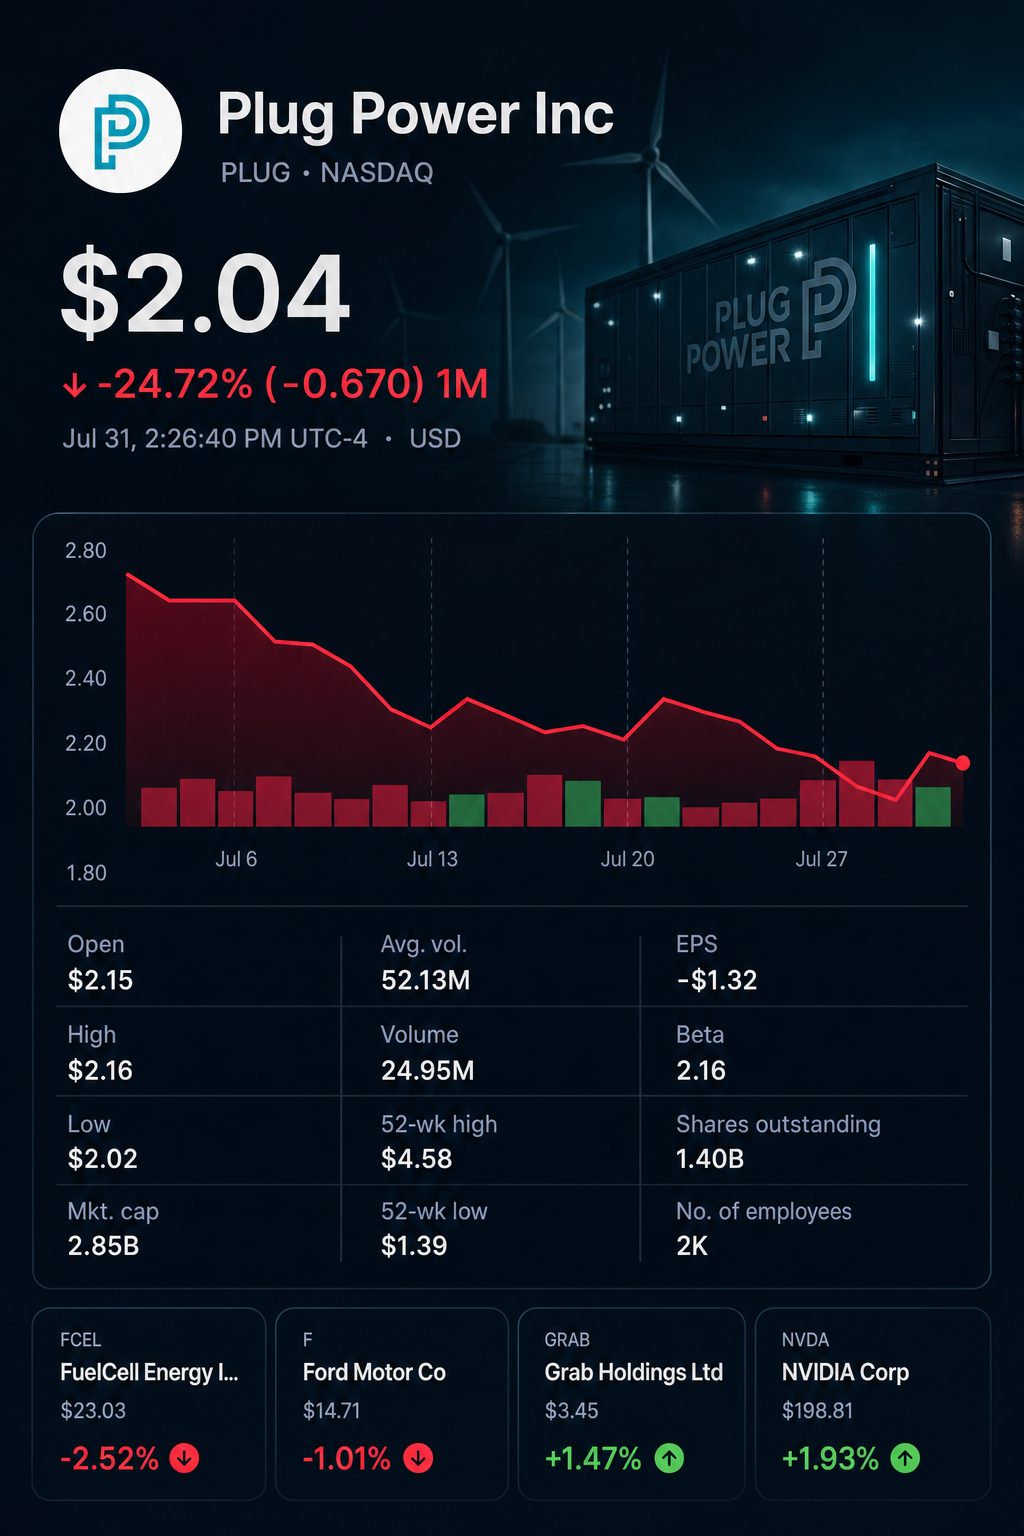
Stock chart for NASDAQ:PLUG

The upcoming milestone is the Graham, Texas, transaction, anticipated to close by July 31. Plug is set to receive $50 million when the deal closes, with an additional $26.5 million tied to the final load capacity.

The deal covers land and 164 MW of grid-interconnection assets. At the highest price, this comes to about $466,000 per MW. A separate release of collateral may push overall liquidity to $90.5 million.

The amount represents 60% of Plug’s operating cash outflow for the first quarter. It is helpful, though not a game changer.

Hydrogen sector, real-time overviewPriceDay changeMarket capitalization
Plug Power Inc. $2.05-1.9%$2.85 billion
Bloom Energy Corp. $215.44+4.0%$69.68 billion
FuelCell Energy Inc. $23.11-2.2%$1.25 billion
Ballard Power Systems Inc. $2.75-1.6%$0.82 billion

Market data as of around 13:55 EDT.

The sector saw a clear divide. Bloom rose 4%, but the other three stocks fell. Plug’s market capitalization stayed at under one-twentieth that of Bloom.

Bloom reported second-quarter revenue of $1.07 billion, a rise of 166%. The company posted a GAAP gross margin of 33.4%.

Latest quarter reportedPlug PowerBloom Energy
Period reportedQ1 2026Q2 2026
Total revenue$163.5 million$1.07 billion
Annual growth rate22.3%165.5%
GAAP gross margin-13.2%33.4%
GAAP operating profit/(loss)$(109.5) million$182.2 million
Present market capitalization$2.85 billion$69.68 billion

Comparison for the most recent quarters; reporting dates vary.

Bloom reported quarterly revenue that was 6.5 times greater than Plug’s most recent result. The company’s gross margin surpassed Plug’s by 46.6 percentage points. Bloom’s market capitalization was about 24 times higher than Plug’s valuation.

This distinction highlights Plug’s unique approach in the data-center sector. Stream is acquiring hard-to-secure grid connections, rather than hydrogen production itself. Both firms are considering additional Plug solutions in the future. At present, the tangible upside is an influx of cash.

Plug announced preliminary unrestricted cash totaling $162 million as of June 30, $61.2 million less than its March 31 level. The June amount is still subject to final audit.

Plug liquidity bridgeAmount
Unrestricted cash as of March 31$223.2 million
Estimated unrestricted cash as of June 30$162.0 million
Cash decrease in sequence$61.2 million
Expected near-term additional liquidityMore than $80.0 million
Pro forma unrestricted cash totalMore than $242.0 million
Operating cash consumed in Q1$150.0 million
Pro forma coverage using Q1 burn rateMore than 1.61 quarters
Total Graham-related liquidity availableUp to $90.5 million

Pro forma figures are based on deal closure with no additional cash activity.

If the inflow surpasses $80 million, cash holdings would rise above $242 million. This would exceed the March total by a minimum of $18.8 million. However, that amount would fund roughly 4.8 months of first-quarter operating expenditure.

The operating recovery is still unfinished. Revenue increased, while gross losses decreased. However, cash outflow rose.

Plug Power Q1 performanceQ1 2026Q1 2025Change
Revenue$163.5 million$133.7 million+22.3%
GAAP gross loss$21.6 million$73.9 million-70.7%
GAAP operating loss$109.5 million$178.5 million-38.6%
Operating cash outflow$150.0 million$105.6 million+42.1%
Weighted average shares1.390 billion0.946 billion+46.9%

Loss amounts are presented as total values.

Operating cash outflow increased 42% from a year earlier. Weighted average shares climbed 47%, further diluting each recovery unit. Stronger cash conversion is required in the next quarter.

“Monetizing these assets was a key part of our strategy this year,” CEO José Luis Crespo said. Plug stated that second-quarter earnings would be released soon. That report is expected to detail operating cash outflows separately from cash received from assets. Plug Power

Risks: The Texas deal is still subject to certain conditions. The contingent payment of $26.5 million may be reduced or may not be received. The larger transaction in New York is pending reviews through March 2027. Plug’s filings additionally highlight anticipated capital and liquidity requirements.

TS2 TECH • EXTENDED COVERAGE

Further analysis

What is Plug Power stock doing today?
Plug Power traded near $2.06 around 2 p.m. EDT, down about 1.5%. The shares ranged from $2.02 to $2.17 on roughly 24 million shares. The Wall Street Journal The Dow, mid-cap index and energy sector were higher during that snapshot. PLUG therefore lagged both the broad market and its sector. The stock remains about 55% below its $4.58 52-week high. It is still roughly 5% above the $1.97 year-end 2025 close. The Wall Street Journal
Did the latest quarter show a real operating improvement?
Yes, but Plug still lost money at every major profit line. Q1 revenue rose 22% to $163.5 million. GAAP gross margin improved to negative 13% from negative 55%. Operating loss narrowed to $109.5 million from $178.5 million. Adjusted loss improved to eight cents per share from 17 cents. SEC GAAP net loss widened to $246.0 million from $196.9 million. Management tied roughly $140 million mainly to non-cash valuation charges. SEC
How much cash does Plug Power have?
Plug reported about $162 million of unrestricted cash on June 30. That preliminary figure excluded proceeds from the transactions announced in July. Plug Power It held $223.2 million on March 31, a $61.2 million decline. Q1 operating activities used $150.0 million of cash. SEC In May, Plug said available capital could fund at least 12 months. That conclusion partly assumed access to its ATM and standby equity programs. Financing risk therefore remains material. SEC
Will the Stream Data Centers deals remove the liquidity risk?
Not yet, although they could extend the cash runway materially. The Texas agreement offers $50 million at closing and $26.5 million contingently. Releasing related collateral could lift total Texas liquidity to $90.5 million. The New York sale has a fixed $142 million price, but remains staged. Its final non-land closing deadline now extends to March 31, 2027. Plug Power Plug expected more than $80 million from the initial Texas and New York steps. However, it had not announced the Texas closing by today’s market snapshot. Plug Power
How serious is shareholder dilution?
It remains one of Plug’s largest valuation risks. Q1’s weighted average share count rose 47% year over year. It reached 1.390 billion, while May 6 shares totaled 1.395 billion. Authorized common shares doubled to 3.0 billion during February. SEC Plug had $944.1 million available through its at-the-market program. A separate $1.0 billion standby facility remained unused during Q1. Potential dilutive securities represented another 431.6 million shares at March 31. SEC
Can Plug still reach positive EBITDAS in the fourth quarter?
Management still targets positive EBITDAS, a non-GAAP measure, in Q4 2026. That target requires another sharp margin improvement. Q1 gross margin remained negative 13%, despite a 42-point annual improvement. Operating loss still totaled $109.5 million. SEC FactSet’s 2026 consensus loss is about $0.35 per share. That estimate worsened from $0.31 three months earlier. Lower cash use must accompany any further margin gains. The Wall Street Journal
What must the second-quarter results show?
Revenue estimates currently range from about $163 million to $172 million. The EPS consensus centers near an eight-cent loss. ChartMill That revenue band implies roughly flat to 5% sequential growth. FactSet lists August 12, although Plug had not announced an official date. The Wall Street Journal The critical test is whether gross margin improves beyond negative 13%. Investors also need lower cash use and confirmed asset-sale proceeds. A retreat from the Q4 EBITDAS target would weaken current forecasts.
What does Wall Street’s price forecast imply?
FactSet’s consensus rating remains Hold. It shows six Buy, one Overweight, 11 Hold, one Underweight and three Sell ratings. The average target is $3.48, with a $3.50 median. The Wall Street Journal Against $2.06, the average target implies about 69% upside. Forecasts range from $0.75 to $7.00. That equals roughly 64% downside or 240% upside. The unusually wide spread signals low forecast confidence.
What operating catalysts could improve the outlook?
Large electrolyzer orders offer the clearest growth route beyond warehouse fuel cells. Plug announced a 50 MW Orica order on July 9. It also commissioned a 5 MW Danish electrolyzer system during June. Plug Power Q1 disclosures showed more than 320 MW deployed and an $8 billion project pipeline. SEC Pipeline is not booked revenue. Conversion depends on customer financing, final investment decisions and delivery timing. Successful execution would support growth; delays would return attention to cash.

Roman Perkowski is a senior markets reporter at TS2.tech, specializing in stocks, technology and macroeconomic trends. A graduate of the Cracow University of Economics, he previously worked in investment research and corporate finance. His coverage helps readers understand the key forces driving global financial markets and emerging industries. Follow Roman Perkowski on Google News.

AI PORTFOLIO

Top Stock Picks

Today’s highest-ranked model selections.

#1 STRONG BUY

Xylem

NYSE: XYL 94 / 100
#2 STRONG BUY

AerCap

NYSE: AER 92 / 100
#3 BUY ON WEAKNESS

Visa

NYSE: V 90 / 100
#4 BUY

Chevron

NYSE: CVX 86 / 100
#5 ACCUMULATE

UPS

NYSE: UPS 84 / 100
View full portfolio
Editorial model selection. Not personalised advice.
MARA Shares Fall Alongside Bitcoin as Lower Treasury Beta Poses Q2 Challenge
Previous Story

MARA Shares Fall Alongside Bitcoin as Lower Treasury Beta Poses Q2 Challenge

Tilray Brands (NASDAQ:TLRY) shares rise, driven by growth in beverages and distribution
Next Story

Tilray Brands (NASDAQ:TLRY) shares rise, driven by growth in beverages and distribution