
NEW YORK, July 30, 2026, 16:03 EDT — The closing bell marked the end of U.S. cash trading.
- The S&P 500 rose 1.45% and the Nasdaq climbed 2.53%.
- Shares of Microsoft NASDAQ:MSFT jumped 17%, contributing roughly 54% of the S&P’s overall increase.
- Declining stocks on the S&P outpaced those rising by a ratio of two to one. Long-dated Treasury yields stayed close to their highest levels in several years.
U.S. equities ended with strong gains on Thursday, boosted by a 17% jump in Microsoft shares. The S&P 500 advanced 1.45%, and the Nasdaq climbed 2.53%.
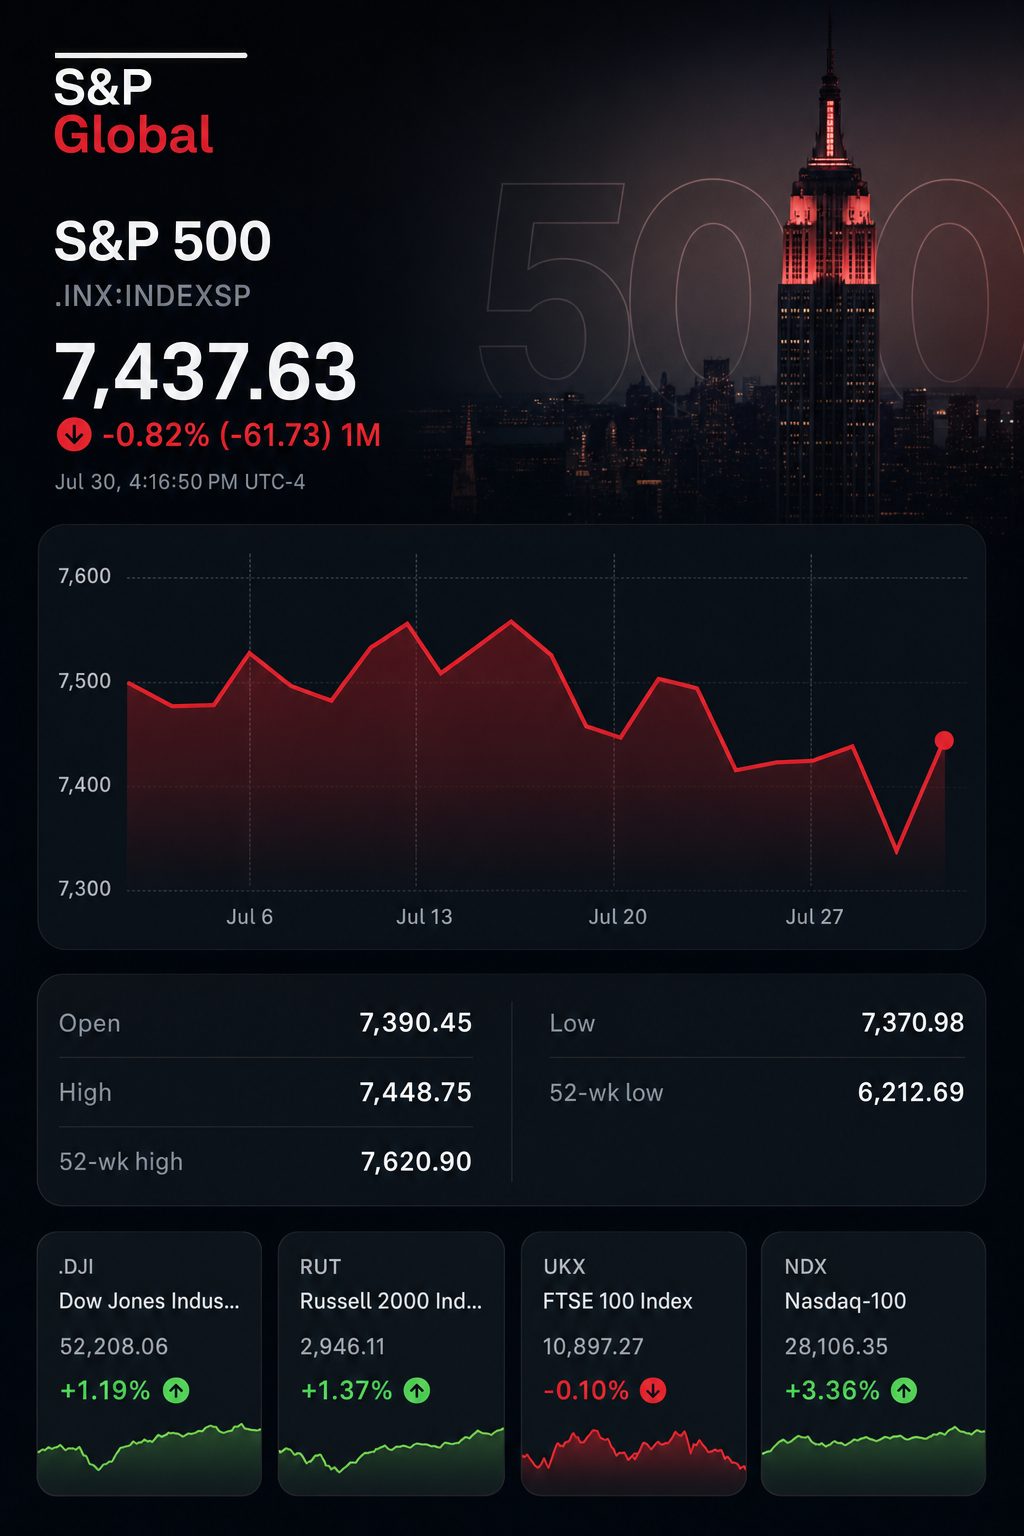
The index appeared robust, but underlying figures told a different story. In the S&P 500, decliners led advancers by a two-to-one margin. Investor focus remained fixed on concentration during the session.
| Index | Thursday close | Thursday | Wednesday | Two-day return |
|---|---|---|---|---|
| S&P 500 | 7,421.97 | up 1.45% | down 1.52% | off 0.09% |
| Nasdaq Composite | 25,060.99 | gained 2.53% | fell 1.74% | advanced 0.75% |
| Dow Jones Industrial Average | 52,122.78 | rose 1.02% | dropped 2.19% | lost 1.19% |
Returns over two days are compounded from the movements on Wednesday and Thursday.
Thursday’s recovery offset much of the broad decline seen on Wednesday. Over the two sessions, only the Nasdaq closed in positive territory. The Dow was still down 1.19%.
An initial calculation by weight illustrates the point. Microsoft accounted for approximately 0.78 percentage points, representing 54% of the S&P’s rise. Meta Platforms NASDAQ:META took away about 0.18 point.
| Company | S&P weight prior to Thursday | Stock movement | Projected S&P effect |
|---|---|---|---|
| Microsoft NASDAQ:MSFT | 4.61% | +17% | +0.78 percentage point |
| Meta Platforms NASDAQ:META | 2.05% | -9% | -0.18 percentage point |
| Combined | 6.66% | — | +0.60 percentage point |
Initial calculations apply July 29 SPDR S&P 500 ETF Trust NYSEARCA:SPY portfolio weights to Thursday’s changes in share prices. These figures do not account for intraday rebalancing or rounding adjustments.
Microsoft posted Azure growth of 43%, surpassing the analyst forecast of 39.98%. The company projected 45% constant-currency growth for this quarter, while analysts anticipated 40.92%.
Free cash flow totaled $19.6 billion on revenue of $90 billion. The figure beat the consensus estimate of $13.44 billion, even with significant infrastructure investments. Microsoft projected roughly $50 billion in capital expenditures for the current quarter.
Jed Ellerbroek, portfolio manager at Argent Capital, stated that Microsoft has the potential to shift from being part of an AI “battleground” to joining the ranks of “trusted AI winner.” The company’s stock posted its largest single-day increase in 18 years. Reuters
Meta showed a contrasting trend in cash flow. Revenue climbed 28% to $60.80 billion, while expenses surged by 55%. Free cash flow declined to $784 million.
| Latest reported quarter | Revenue | Free cash flow | FCF as percentage of revenue | Share move |
|---|---|---|---|---|
| Microsoft NASDAQ:MSFT | $90.00 billion | $19.60 billion | 21.8% | +17% |
| Meta Platforms NASDAQ:META | $60.80 billion | $0.78 billion | 1.3% | -9% |
Initial cash-flow ratios are based on disclosed revenue and free cash flow. Fiscal year schedules vary among the companies.
The divergence indicates investors remain in favour of substantial AI investments, but are also insisting on clear cash generation as a result. Meta reported quarterly capital expenditure of $31.08 billion.
The recovery extended to semiconductor stocks. Shares of Micron Technology NASDAQ:MU jumped 18%, SanDisk NASDAQ:SNDK added 24%, while Advanced Micro Devices NASDAQ:AMD increased 14%. The Philadelphia semiconductor index was up nearly 8%.
The Nasdaq registered 126 new lows while 58 stocks hit new highs. The S&P saw four stocks reach new highs and four mark new lows. Activity on the tape was selective.
Economic indicators delivered conflicting messages. Growth in the second quarter eased, while core private demand picked up speed. The numbers are provisional and will be updated when the government issues its next estimate on August 26.
| U.S. indicator | Latest reading | Previous reading |
|---|---|---|
| Real GDP, annualized | 1.5% for Q2 | 2.1% for Q1 |
| Private domestic final sales | 3.9% for Q2 | 1.7% for Q1 |
| Headline PCE inflation, year-on-year | 3.7% as of June | 4.1% as of May |
| Core PCE inflation, year-on-year | 3.3% as of June | 3.4% as of May |
Bonds provided scant respite. The yield on the 30-year Treasury touched its highest level in 19 years in the session. Traders saw the probability of a rate hike in September drop to 59%, compared to 82% the previous week.
Apple NASDAQ:AAPL and Amazon.com NASDAQ:AMZN were set to release results after markets closed. Earnings calls for both are planned at 5 p.m. EDT. Cash-flow forecasts from the companies may challenge the current leaders of the rally.
The market close did not indicate a broad risk-on move. Instead, it acted as a cash-flow benchmark within the AI sector. Firms combining aggressive investment with robust cash flow saw the most pronounced gains.
Risks: Robust earnings from Apple or Amazon may encourage wider market involvement. However, rising long-term yields, softer outlooks, or a reversal in Microsoft could swiftly reverse the focused market recovery.
Related articles: NASDAQ:META