NEW YORK, July 29, 2026, 05:05 EDT — Regular U.S. cash trading remained shut while activity picked up in premarket sessions.
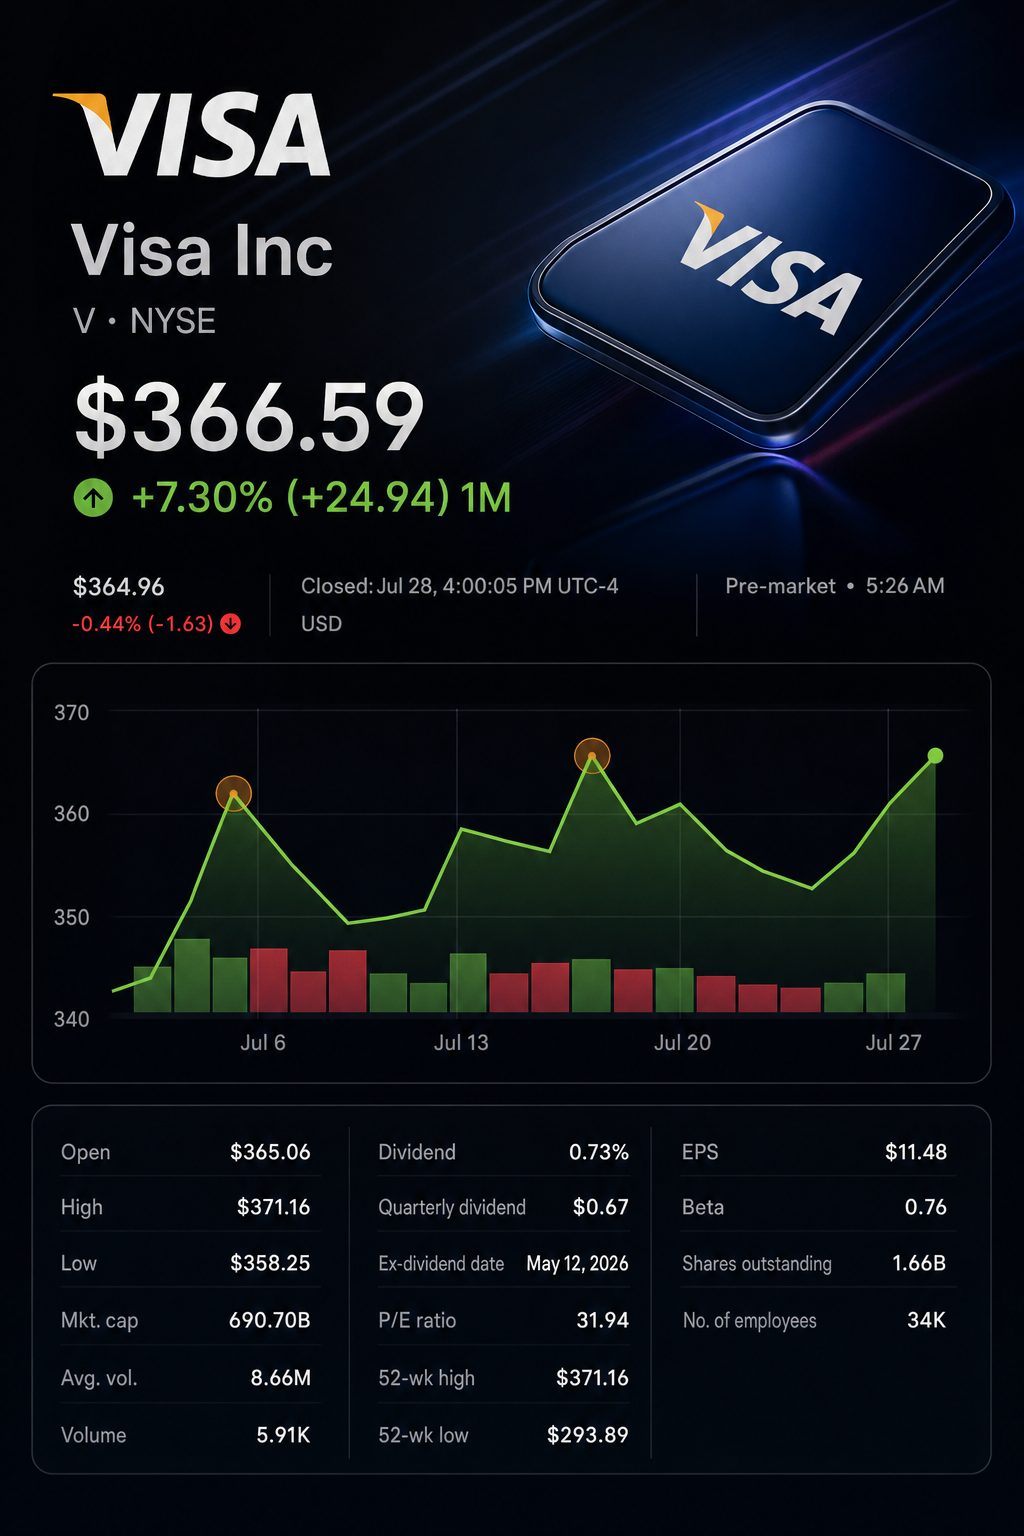
Visa finished Tuesday trading at $366.59, rising 1.1%. Early premarket indications showed the stock down 0.3% to around $365.59.
Adjusted earnings were $3.32 per share, topping the LSEG consensus of $3.23. Revenue came in at $11.63 billion, ahead of the $11.39 billion forecast.
Cross-border volume, not counting intra-Europe, climbed 12%. Revenue from international transactions was up only 6%.
Visa shares slipped ahead of Wednesday’s opening bell, even after reporting earnings above expectations. Investors looked closely at the company’s efficiency in translating robust spending into revenue.
Payments volume for the quarter surpassed $4 trillion for the first time, increasing by 10% on a constant dollar basis. The number of processed transactions also climbed 10%, reaching 71.7 billion.
Visa’s international segment presented a weaker spot. Cross-border volume, excluding intra-Europe, rose by 12%, while international transaction revenue from these activities grew just 6%.
The comparison does not reflect a direct yield calculation. Volume is measured in constant dollars, whereas revenue is given in nominal terms. Nonetheless, the disparity indicates that increases in transactions did not translate uniformly into revenue.
The company said the variation was due to changes in currency rates and the composition of its business. The conversion rate was also influenced by a larger share of lower-yield money-movement flows, such as Visa Direct.
Year-on-year increase
Q2 2026 (Fiscal)
Q3 2026 (Fiscal)
Rate shift
Payments volume
9%
10%
+1 point
Total cross-border volume
12%
13%
+1 point
Processed transactions
9%
10%
+1 point
Net revenue
17%
14%
-3 points
International transaction revenue
10%
6%
-4 points
Client incentives
14%
18%
+4 points
Volume is calculated in constant dollars. Nominal company figures are used for revenue and incentive increases.
The table illustrates investor unease. Core operations picked up pace, but revenue growth lost momentum and client incentives increased more rapidly.
Visa benefits from its services segment as a hedge. Revenue from value-added services climbed 34% in constant dollars, totaling $3.8 billion and making up about a third of net revenue for the quarter.
Capital returns also gave a lift to per-share growth. Adjusted net income climbed 8%, and adjusted earnings per share were up 11%. The three percentage-point difference signals the benefit from a reduced share count.
Visa bought back 14.5 million shares at a total cost of $4.9 billion, with an average purchase price of $330.71, which is almost 10% lower than where shares closed on Tuesday.
Expenses continued to be the most significant pressure. Adjusted operating costs climbed 17%, outpacing revenue growth of 14%. Client incentives were up 18%.
Visa intends to cut approximately 2,600 jobs, representing 7% of its staff. The majority of these layoffs will impact employees in technology and product divisions. Severance expenses for the quarter totaled $563 million.
The company stated that cost savings are planned to be directed towards businesses with higher growth potential, such as acceptance offerings, value-added solutions, stablecoins, and AI-powered commerce. This approach reduces the likelihood of a near-term surge in margins.
Consumer demand continues to be steady. Chief Executive Ryan McInerney stated consumer and business spending “remains resilient.” David Wagner of Aptus Capital Advisors added the beat “wasn’t a fluke or an accounting trick.” Q4 Capital
The World Cup provided a short-term lift. Chief Financial Officer Chris Suh reported that card-present transactions increased by up to 20% in certain host cities during match days. Cross-border spending gains were driven mainly by restaurants and entertainment.
Visa anticipates its fourth-quarter revenue to rise toward the upper part of the low double-digit percentage range. Adjusted earnings per share are projected to increase at the bottom of the mid-teens. For the full year, the company’s outlook signals revenue growth at the low end of the low-teens spectrum and EPS growth at the low end of mid-teens figures.
Mastercard Incorporated NYSE:MA is set to release its second-quarter earnings on Thursday at 09:00 EDT. Trends in cross-border revenue and incentives will signal whether Visa’s conversion gap reflects an industry trend or a company issue.
Risks persist. World Cup-related expenses are set to return to usual levels, incentive costs are increasing, and softer consumer activity may dampen transaction growth. Visa reported a $237 million litigation charge for the quarter.
Visa continues to show strong demand signals. The next challenge will be turning double-digit volume growth into higher revenue and profits, while avoiding greater dependence on share repurchases.
What caused Visa shares to decline following a robust earnings outperformance?
Visa shares ended Tuesday at $366.59, rising 1.12% ahead of its earnings report. In after-hours trading, the stock dropped around 1% to 2%, varying with the timing. The quarterly results exceeded forecasts, but adjusted operating expenses increased 17%. Client incentives were up 18%, outpacing Visa’s net revenue gains. The stock had already set a new 52-week high during the day. Expectations going into the report were higher than usual.
By how much did Visa surpass expectations with its third-quarter earnings?
Net revenue rose 14% to $11.63 billion, exceeding LSEG consensus of $11.39 billion and resulting in a $240 million beat. Adjusted EPS stood at $3.32, above analysts' estimate of $3.23. GAAP net income advanced 7% to $5.6 billion for the quarter, while GAAP EPS increased 10% to $2.97 per diluted share. The outperformance was driven by higher transaction volumes, increased demand for services, and currency tailwinds.
Do Visa’s payment volumes reflect genuine consumer strength?
Quarterly payments volume surpassed $4 trillion for the first time, marking a 10% rise year-on-year on a constant-currency basis. The number of processed transactions climbed 10% to 71.7 billion in the quarter. U.S. payments volume was up 10%, the fastest pace since fiscal 2019, excluding the atypical rebound after the pandemic. U.S. credit volume increased by 11%, while debit volume advanced 9%. Visa observed no decline in spending among consumers in lower spend categories.
What impact did the World Cup have on cross-border growth?
Total cross-border volume increased by 13% year-on-year in constant currency terms. When excluding intra-Europe activity, growth was 12%, higher than the 11% gain in the prior quarter. FIFA-related spending supported both North America and Latin America through June. Card-present transactions in certain host cities climbed up to 20% on days when matches were held. Management stated that no region accounts for more than 25% of Visa’s cross-border volume. Underlying travel trends stayed solid, though spending tied to the event is likely to normalize.
What caused international transaction revenue to trail behind cross-border volume?
International transaction revenue increased by just 6% to $3.9 billion. Cross-border volume, excluding intra-Europe, expanded at double that pace to 12%. Management pointed to reduced currency volatility versus last year’s peak levels. Additionally, differences in transaction mix and yields across the business tempered revenue conversion. The resulting gap is significant. It could restrict earnings potential despite robust international travel volumes.
What are the implications of Visa’s revised outlook for fiscal 2026?
Visa projects full-year adjusted revenue to rise at the lower end of the low teens range. Adjusted operating expenses are also expected to increase at the low end of low teens. Visa sees adjusted EPS growing at the lower end of mid teens. For the fourth quarter, revenue growth is forecast at the high end of the low double digits, while EPS growth guidance is set at the low end of the mid teens. Revenue and EPS forecasts were raised from April, but expense projections also increased. These guidance figures exclude acquisition effects and rely on constant-currency comparisons.
Is the 7% cut to headcount expected to have a significant impact on margins?
Visa intends to reduce about 2,600 roles, mainly within its technology and product divisions. The company posted $563 million in severance charges for the third quarter due to these workforce adjustments. Management stated that the cost savings will support investments in areas with higher growth potential, indicating there may be minimal short-term impact on profit margins. However, adjusted operating expenses still rose 17% for the quarter. Investors should monitor whether expense increase moderates to low double digits in the fourth quarter.
Are value-added services emerging as Visa’s primary driver of growth?
Revenue from value-added services grew by 34% at constant currency, reaching $3.8 billion. Income from commercial and money movement solutions climbed 17% compared to the previous year. Visa Direct transaction volumes rose 21% over the quarter. Contributions from Prisma, combined with higher prices and product usage, supported results. Acquisitions accounted for less than 1.5 percentage points of overall third-quarter revenue improvement. The services portfolio is becoming more influential, yet organic growth was not solely responsible.
Does Visa’s valuation remain justified close to all-time highs?
Visa traded at $366.59, placing it 1.2% below Tuesday’s intraday peak of $371.16. For fiscal 2025, adjusted earnings per share came in at $11.47. Using the low end of the mid-teens growth projection, fiscal 2026 adjusted EPS is estimated at around $13.1. This values the stock at roughly 28 times current-year adjusted profit. The EPS figure is an inferred estimate and is not official company guidance. The valuation reflects expectations for ongoing double-digit growth and steady operating margins.
To what extent do buybacks and dividends provide support?
Visa bought back 14.5 million shares for $4.9 billion in the quarter. The average purchase price was $330.71, lower than the closing price on Tuesday. As of June 30, $28.4 billion remained available under the buyback program. The board announced a quarterly dividend of $0.67, to be paid on September 1. The annualized dividend yield stands at roughly 0.7% at $366.59. Share repurchases continue as the leading capital return method.
Roman Perkowski is a senior markets reporter at TS2.tech. His coverage ranges from stocks and technology to economic developments across global markets. He graduated from the Cracow University of Economics and worked in investment research and corporate finance before becoming a financial journalist. Follow Roman Perkowski on Google News.
Surprising starts and permits data can impact homebuilders, mortgage-sensitive stocks, Treasury yields, and the dollar if results deviate significantly from consensus estimates.
#02
Home Depot Q2
The results and outlook provide key insights into housing turnover, renovation demand, professional customer activity, and U.S. discretionary spending.
#03
09:15 ET industrial production
A robust or disappointing factory or utilities report can shift expectations for economic growth, cyclical stocks, bond yields, and the Federal Reserve’s policy direction.