NEW YORK, July 29, 2026, 05:57 EDT – SoFi Technologies Inc (SOFI.O) is approaching its second-quarter earnings release with a key test for its profit margins in the second half, aiming to meet a 38% threshold as investors monitor closely.
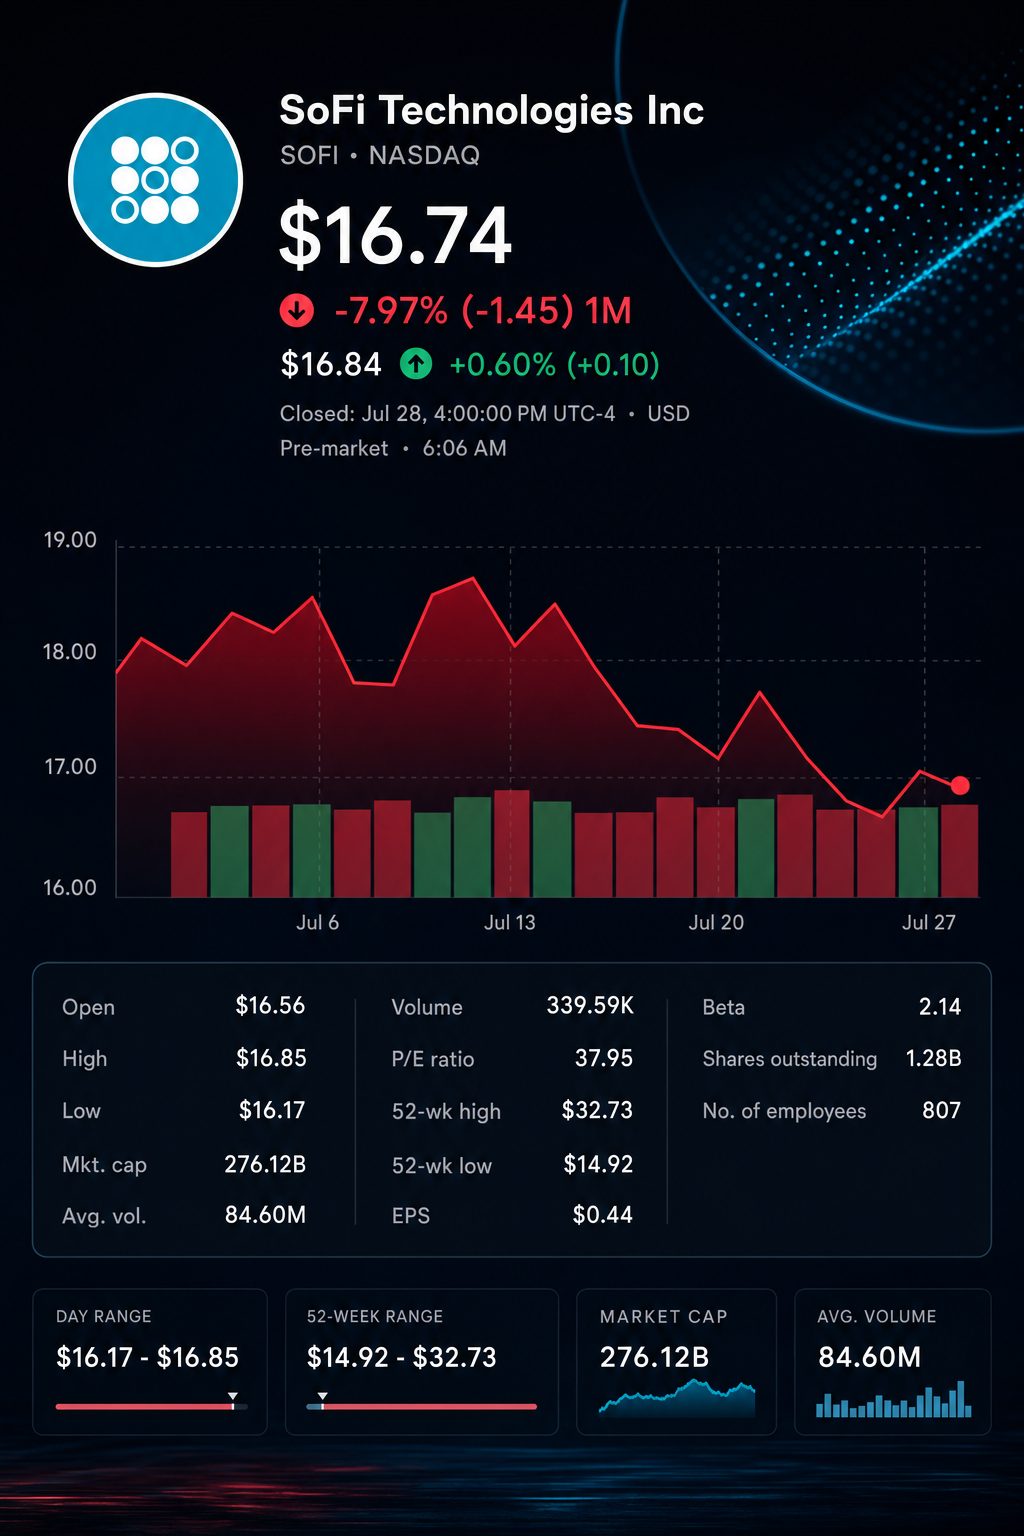
SoFi gained 0.5% before the market opened, following a $16.74 close on Tuesday.
Zacks projects revenue of $1.11 billion and per-share earnings of $0.11.
Initial guidance calculations indicate an adjusted EBITDA margin of 37.7% for the second half.
SoFi Technologies NASDAQ:SOFI saw modest gains in premarket trading on Wednesday. The stock was quoted around $16.83 at 5:54 a.m. EDT.
The broader assessment aligns with its full-year outlook. Present forecasts indicate a 37.7% adjusted EBITDA margin for the second half, based on initial figures. EBITDA does not include interest, taxes, depreciation or amortization.
That figure is nearly eight percentage points higher than the target for the second quarter. As a result, the forward outlook could be more significant than a minor headline beat.
SoFi is scheduled to release its second-quarter earnings at approximately 7 a.m. EDT, with a conference call set to start an hour after. U.S. regular trading is still shut.
The Zacks consensus estimate stands at $1.11 billion in revenue with earnings of $0.11 per share. Company management earlier forecast around 30% growth in adjusted revenue and an EBITDA margin of 30%.
Initial estimate: the Q2 column reflects management’s stated targets for growth and margin applied to reported outcomes. The second-half column aligns these numbers with the full-year outlook.
Metric
Q1 performance
Q2 projected
Second-half needed, initial
Adjusted net revenue
$1.087 billion
$1.116 billion
$2.452 billion combined
Average quarterly revenue
$1.087 billion
$1.116 billion
$1.226 billion
Adjusted EBITDA
$339.9 million
$334.7 million
$925.4 million combined
Average quarterly EBITDA
$339.9 million
$334.7 million
$462.7 million
Adjusted EBITDA margin
31.3%
Roughly 30.0%
Roughly 37.7%
Based on this, the second half is required to deliver 57.8% of full-year EBITDA, while contributing just 52.7% of total annual revenue. This discrepancy places margin discussion at the forefront.
The stock faced pressure ahead of earnings. It closed on Tuesday 5.1% lower than its July 21 price of $17.64.
The scenario is reminiscent of April. Shares of SoFi dropped 12%, even after posting record results for the first quarter, as the guidance was left the same. Analyst Andrew Jeffrey at William Blair noted that management “did not flow through first-quarter revenue and EBITDA upside.” Reuters
The quarter saw robust performance, with adjusted revenue climbing 41% and adjusted EBITDA up 62%. Loan originations surged 68% to $12.2 billion, while membership expanded by 35% to reach 14.7 million.
The business mix continued to show variation. Adjusted revenue from Lending increased by 53%, while Financial Services revenue advanced 41%. Revenue from the Technology Platform declined 27% following the loss of a significant client. Contribution margin decreased to 16% from 30%.
Funding offers the most straightforward backing for improved margins. In the first quarter, deposits made up over 90% of average liabilities. SoFi reported that deposits were 155 basis points cheaper than warehouse funding, equating to roughly $622 million in annualized interest savings.
Anthony Noto, Chief Executive, said to Reuters that “the health of our consumer base remains strong.” He added he anticipates solid demand for loans in the second quarter and noted that credit performance was in line with forecasts. Reuters
SoFi announced a fresh brand investment on Tuesday, unveiling its partnership with Notre Dame Athletics. The deal features a $1.4 million yearly student-athlete fund. The statement did not disclose the overall value of the larger agreement.
Throughout the week, investors are set to examine guidance, credit conditions and platform revenue. The Federal Reserve’s decision on Wednesday provides another catalyst linked to interest rates.
Risks include increased charge-offs, sluggish loan sales, escalating deposit expenses or ongoing contractions in the platform, all of which could impede margin expansion. Sustained elevated rates may further limit demand for refinancing.
A slight Q2 outperformance might not resolve the argument. Investors require a convincing strategy to achieve the second-half margin that is already reflected in current guidance.
What does SoFi need to achieve in its Q2 results today?
As of the most recent review, SoFi’s investor site continued to display Q1 as the latest available report. The Q2 earnings release was set for around 7 a.m. Eastern on July 29. Management projected approximately $1.115 billion in adjusted net revenue, aiming for a 30% adjusted EBITDA margin and an adjusted net-income margin between 12% and 13%. Public consensus estimates point to about $1.11 billion in revenue and EPS in the $0.11 to $0.12 range.
Is management expected to increase full-year 2026 guidance?
The latest outlook forecasts $4.655 billion in adjusted net revenue, with a target of $1.6 billion adjusted EBITDA and $0.60 in adjusted EPS. Adjusted net income is expected to be around $825 million. Membership is projected to grow by a minimum of 30% year-over-year. Following the first quarter, $3.568 billion in revenue remains for the next three quarters. Investors could press for an increase. The guidance staying unchanged led to a 12% drop in shares after the Q1 earnings.
Is SOFI considered inexpensive at approximately $16.74?
SOFI last traded at $16.74, with a market capitalisation of around $23.1 billion. The stock's trailing P/E stood at roughly 37.2 with EPS of $0.45. Management projects adjusted EPS of $0.60, reflecting a forward P/E close to 27.9. Shares trade at almost five times the adjusted revenue outlook and approximately 2.3 times Q1 tangible book value. Comparisons draw from both GAAP and adjusted figures, affecting like-for-like analysis.
Is it possible for loan growth to stay robust without using excessive capital?
Q1 originations totaled $12.2 billion, up 68% from a year earlier. Personal loan origination amounted to $8.34 billion, of which $3.0 billion was for third parties. Originations in student loans reached $2.61 billion, and home loans accounted for $1.22 billion. SoFi sold or transferred over $3.8 billion in personal and home loans, highlighting the importance of the capital-light approach. For Q2, the focus is to sustain high origination volumes without significantly increasing on-balance-sheet exposure.
Is the quality of consumer credit remaining stable?
The personal-loan charge-off rate stood at 3.03%, which represents a decrease of 28 basis points from a year earlier. This figure increased compared to 2.80% in the previous quarter. SoFi calculated an all-in rate close to 4.4% when delinquent-loan sales are excluded. The ninety-day delinquency rate remained unchanged versus the same period last year. These statistics vary since loan sales have an impact on reported charge-offs. Investors will compare Q2 losses to SoFi’s 7%–8% lifetime target.
Do deposits and margins continue to boost earnings?
At the end of Q1, deposits totaled $40.24 billion, increasing by $2.74 billion over the quarter. Average deposits covered over 90% of average total liabilities. Net interest margin stood at 5.94%, up 22 basis points from the prior quarter. Deposit costs remained 155 basis points below warehouse funding costs. SoFi calculated that its funding mix generated an estimated annual savings of $621.8 million.
Does Financial Services remain SoFi's leading non-lending division?
Financial Services revenue climbed 41% to $428.5 million for Q1. Noninterest income advanced 55%, and product revenue gained 40% to reach 19.3 million. Annualized spending on Money and Credit Card neared $25 billion. Contribution profit was up 32% at $195.6 million, while the margin slid by three points. Robust growth persisted. Second-quarter results will indicate if increased costs continue to support sustained operating leverage.
Is the Technology Platform segment on track to achieve stability?
Technology Platform revenue dropped 27% in Q1 to $75.1 million. Contribution profit was down 61% at $12.0 million, giving a margin of 16%. Enabled accounts were 132.9 million, marking a 16% year-over-year fall but a gain of four million versus Q4. The yearly decline was mainly due to the loss of a major client. Investors are looking for proof that revenue has reached a floor.
Is it possible for member growth to remain close to one million each quarter?
Q1 saw an increase of 1.055 million members, bringing the total to 14.706 million. To meet full-year guidance, SoFi needs to grow at least 30% from a base of 13.651 million, pointing to a target of approximately 17.746 million members by year-end. After Q1, SoFi still had to add about 3.04 million more members, which would require a quarterly addition of close to one million. The number of products climbed 39% to reach 22.2 million, offering greater potential for cross-selling.
Michał Rogucki is a senior markets reporter at TS2.tech. His coverage ranges from stocks and technology to economic developments affecting global markets. He graduated from Humboldt University of Berlin and worked in investment research and market analysis before becoming a financial journalist.
Surprising starts and permits data can impact homebuilders, mortgage-sensitive stocks, Treasury yields, and the dollar if results deviate significantly from consensus estimates.
#02
Home Depot Q2
The results and outlook provide key insights into housing turnover, renovation demand, professional customer activity, and U.S. discretionary spending.
#03
09:15 ET industrial production
A robust or disappointing factory or utilities report can shift expectations for economic growth, cyclical stocks, bond yields, and the Federal Reserve’s policy direction.