
NEW YORK, August 21, 2026, 05:16 EDT — U.S. cash markets were closed, while trading continued on the Nasdaq during premarket hours.
- Webull generated about 58 cents in adjusted operating profit for every additional dollar of revenue.
- Revenue increased by 51%, as adjusted operating profit surged 169%.
- The shares gave up most of their initial gains and finished just 2.43% higher.
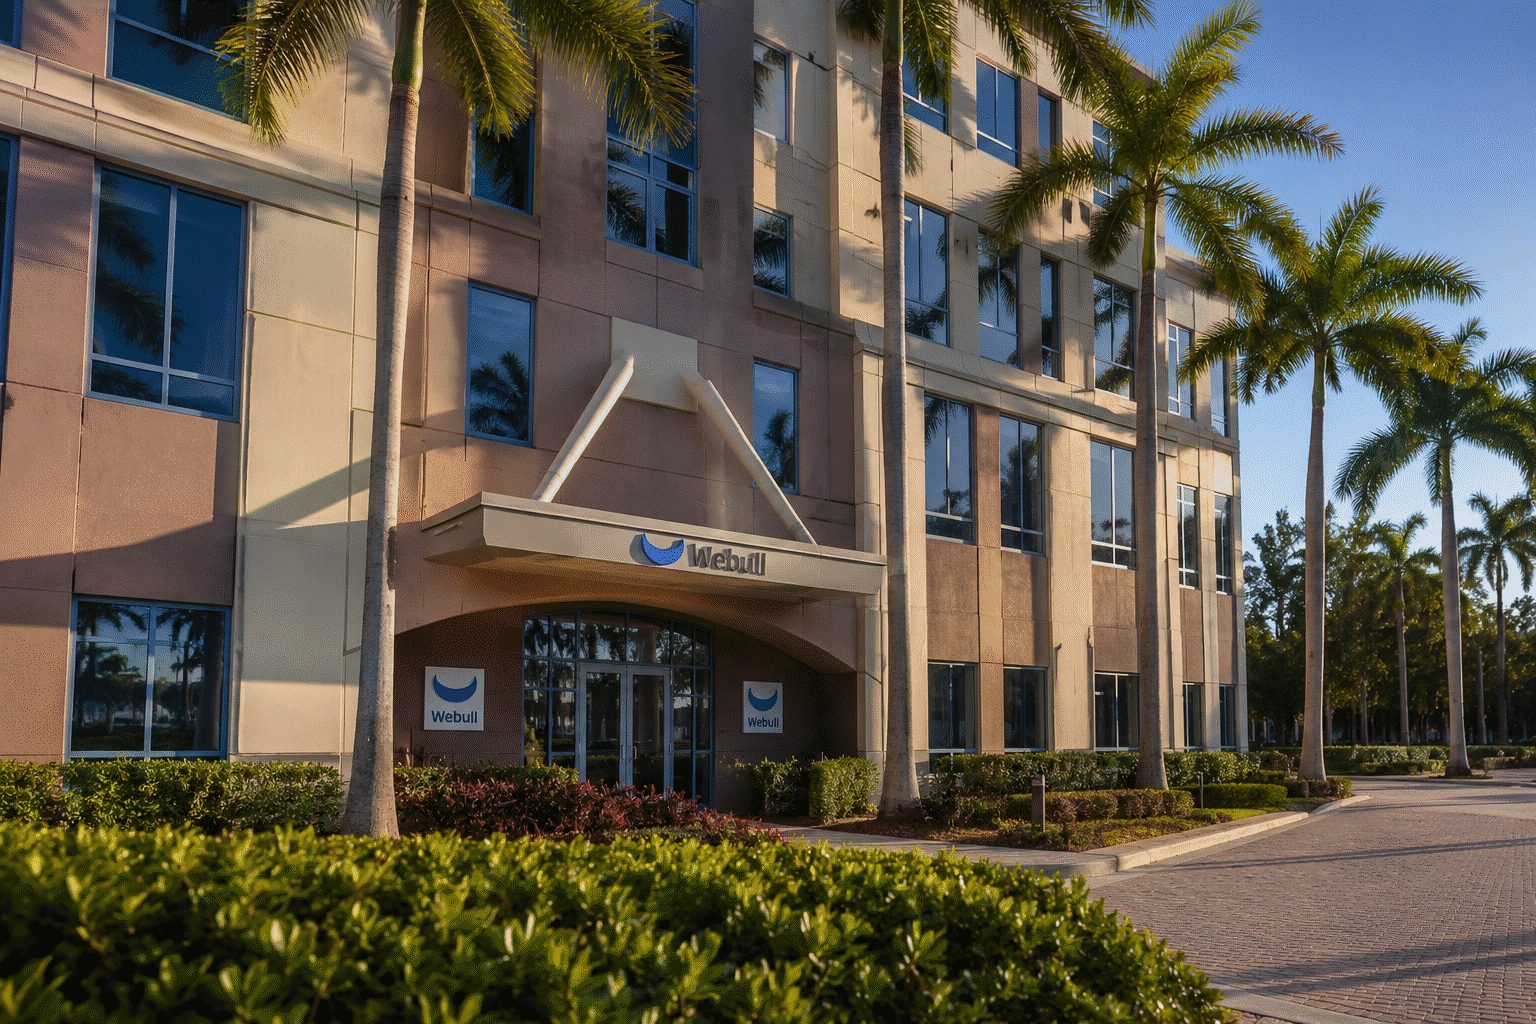
Webull Corporation NASDAQ:BULL reported an incremental adjusted operating margin of 58% for its second quarter. The company saw revenue climb by $67.3 million year-on-year, while adjusted operating profit advanced by $39.3 million.
The conversion rate provides the strongest indication so far of platform leverage. Revenue increased by 51%, compared to a 26% rise in adjusted costs. This moved Webull from a focus on trading volume to one on testing profit growth.
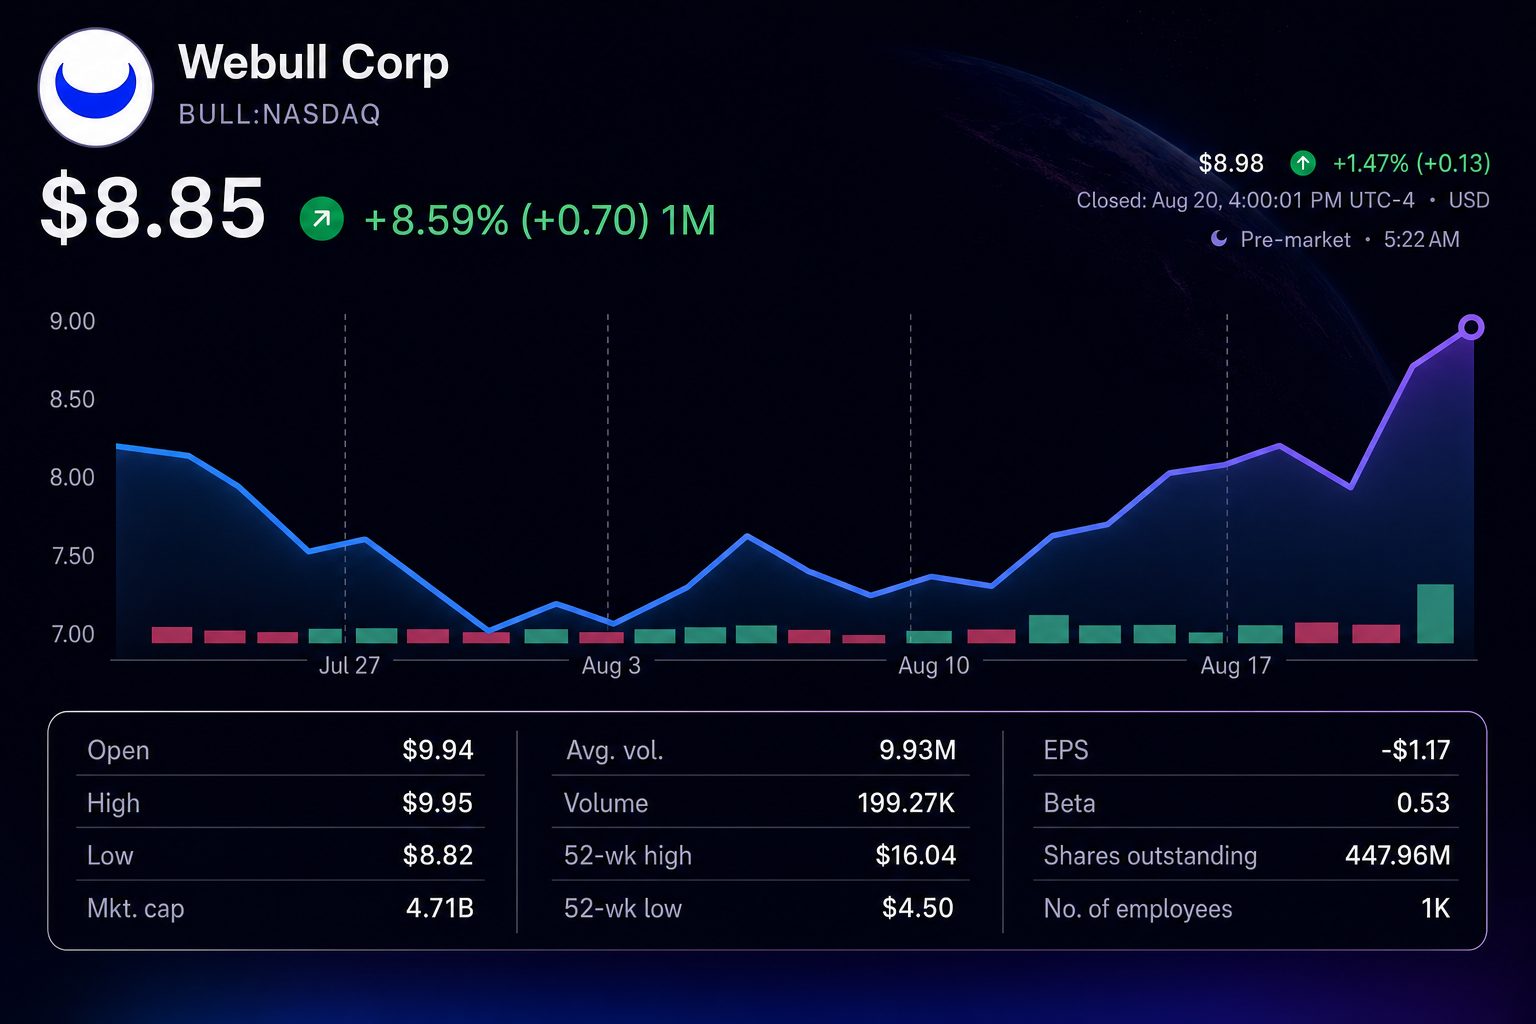
Investors stayed wary. Shares of Webull gained as much as 14% early on Thursday but ended the session at $8.85, advancing 2.43%. Trading volume hit 50 million shares, quadruple its three-month average.
| Operating-leverage measure | Q2 2026 | Q2 2025 | Change |
|---|---|---|---|
| Total revenue | $198.8m | $131.5m | up 51% |
| Adjusted operating expenses | $136.2m | $108.1m | up 26% |
| Adjusted operating profit | $62.6m | $23.3m | up 169% |
| Adjusted operating margin | 31.5% | 17.7% | increase of 13.8 points |
| Incremental profit conversion | 58% | — | Calculated |
Webull posted record revenue of $198.8 million. Revenue from trading increased 66% to $147.7 million. Adjusted net income climbed to $43.2 million from $15.4 million.
| Scale indicator | Q2 2026 | Year-on-year | Investor reading |
|---|---|---|---|
| Daily average revenue trades | 1.64m | +62% | Most active quarter |
| Equity notional volume | $279bn | +73% | Turnover reached all-time high |
| Options contracts | 213m | +68% | More profitable mix |
| Customer assets | $28.5bn | +79% | Deposits and market appreciation |
| Funded accounts | 5.13m | +8% | Participation grew faster than account numbers |
Most of the improvement came from engagement. Daily revenue trades increased at a pace almost eight times that of funded accounts. The average assets held per funded account climbed to approximately $5,560, representing an estimated rise of about 66%.
The $25,000 pattern-day-trader limit was replaced on June 4, which contributed to increased trading activity. FINRA adopted risk-based intraday margin standards, allowing a transition period for brokerage firms. Webull was quick to apply the new rule.
Group President Anthony Denier described the rule change as the quarter’s “defining event.” Denier said that Webull’s technology enabled eligible clients to access the new setting immediately. Options trading volumes in July remained stable, with August volumes aligning more closely with those in June. Webull earnings-call highlights
| Market comparison | Aug. 20 close | Daily move | Context |
|---|---|---|---|
| Webull NASDAQ:BULL | $8.85 | +2.43% | 50.0m shares exchanged |
| Robinhood Markets NASDAQ:HOOD | $95.10 | -0.70% | Online brokerage competitor |
| Interactive Brokers NASDAQ:IBKR | $89.85 | -0.76% | Peer for active traders |
| S&P 500 (INDEXSP:.INX) | 7,641.16 | -0.87% | Market-wide selloff |
The decline carries more weight than finishing in positive territory. Webull outperformed its listed competitors and the wider market. However, despite exceeding revenue estimates by about 20% and surpassing earnings-per-share forecasts by 25%, sellers pushed back against the initial move.
Webull’s provisional market capitalization stood at roughly $4.8 billion at the close on Thursday. This is equivalent to 6.0 times its annualized revenue for the quarter, and 27.8 times its annualized adjusted net income. The ratios are for illustration only and do not represent official company forecasts.
| Analyst | Firm | Rating | Target | Upside from $8.85 |
|---|---|---|---|---|
| Chris Brendler | Rosenblatt | Buy | $15 | 69.5% |
| Michael Grondahl | Northland Securities | Buy | $14 | 58.2% |
| Ed Engel | Compass Point | Buy | $10 | 13.0% |
| S&P Global consensus | Three analysts | Strong Buy | $12.33 | 39.3% |
Rosenblatt increased its price target to $15 from $13 following the earnings. Analyst Chris Brendler referenced stronger revenue capture and movement toward higher-margin trades.
Risks: Trading revenue is exposed to shifts in volatility and changes in retail trading volumes. If market activity slows, the resulting loss of operating leverage is a concern. Additional risks stem from margin lending, options trading, regulatory developments, and Webull’s dual-class governance structure.
The coming week will challenge whether earnings improvements are maintained. Investors are advised to monitor August’s trading patterns, per-trade revenue generation, and the stability of the 31.5% margin as Webull pursues growth in AI, international, and institutional offerings.
Related articles: Earnings Reports