NEW YORK, August 1, 2026, 14:07 EDT — U.S. markets did not trade.
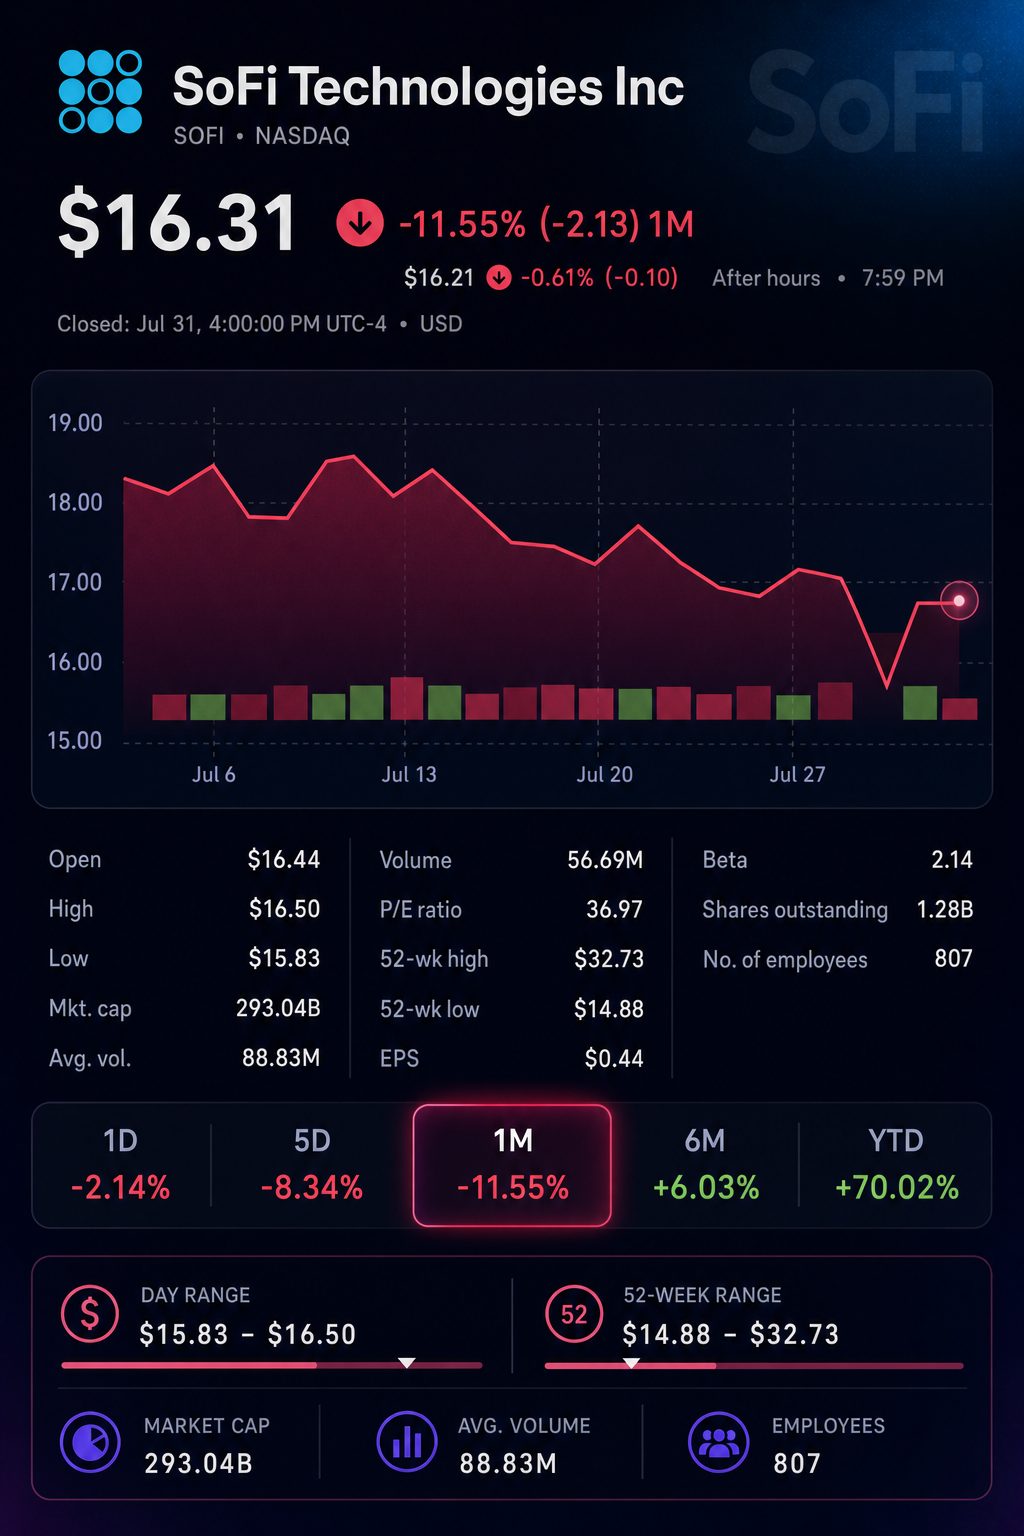
- SoFi ended Friday at $16.31, registering a 0.9% decline over the week.
- Adjusted revenue for the second quarter climbed 40%, while adjusted operating profit was up 44%.
- The midpoint for 2026 revenue increased by 3.1%, while profit guidance remained the same.
SoFi closed at $16.31 on Friday, marking a 0.9% decline for the week. The company’s increased revenue forecast did not impact its 2026 profit outlook.
The difference is significant. The company raised the adjusted revenue midpoint by $145 million. Adjusted EBITDA, a non-GAAP metric for profit, held steady at about $1.6 billion. Forecasts for adjusted net income and earnings per share were unchanged.
| Last week | Closing price | Daily move |
|---|---|---|
| Monday, July 27 | $16.88 | up 2.55% |
| Tuesday, July 28 | $16.74 | down 0.83% |
| Wednesday, July 29 | $15.25 | fell 8.90% |
| Thursday, July 30 | $16.47 | rose 8.00% |
| Friday, July 31 | $16.31 | down 0.97% |
| Change from July 24 week | $16.31 compared to $16.46 | declined 0.91% |
Regular trading provides the basis for closing prices and changes. Weekly return reflects the difference between Friday closing levels.
The stock declined 8.9% on Wednesday, followed by an 8.0% rebound on Thursday. The recovery was not enough to offset the loss sustained on earnings day. In comparison, the Nasdaq Composite was up 1.6% for the week, with SoFi lagging behind by about 2.5 percentage points.
The quarter delivered strong performance. Adjusted revenue climbed 40% year-on-year to $1.206 billion. Adjusted EBITDA increased 44% to $357.8 million. GAAP net income was up 61%.
| Second-quarter result | Q2 2026 | Q2 2025 | Change |
|---|---|---|---|
| GAAP net revenue | $1,218.7 million | $854.9 million | +43% |
| Adjusted net revenue | $1,205.6 million | $858.2 million | +40% |
| Adjusted EBITDA | $357.8 million | $249.1 million | +44% |
| GAAP net income | $156.6 million | $97.3 million | +61% |
| Diluted earnings per share | $0.12 | $0.08 | +50% |
Figures from the company; values are rounded.
Roughly 31% of each extra adjusted revenue dollar contributed to adjusted EBITDA, with SoFi reporting a 31% incremental margin. The company keeping its full-year profit guidance steady is therefore significant.
Some of the market’s caution can be traced to the arithmetic behind the guidance. With the updated revenue midpoint, the implied EBITDA margin drops to 33.3%, compared to 34.4% under the earlier projection. The implied adjusted net-income margin also declines, moving to 17.2% from 17.7%.
| 2026 guidance | After Q1 | After Q2 | Change |
|---|---|---|---|
| Adjusted net revenue | $4.655 billion | $4.75–$4.85 billion | +$145 million at midpoint |
| Adjusted EBITDA | About $1.60 billion | About $1.60 billion | No change |
| Adjusted net income | About $825 million | About $825 million | No change |
| Adjusted earnings per share | About $0.60 | About $0.60 | No change |
| Implied EBITDA margin | 34.4% | 33.3% at midpoint | -1.0 percentage point |
| Implied net-income margin | 17.7% | 17.2% at midpoint | -0.5 percentage point |
Margin comparisons are derived from company-provided guidance. Revenue midpoint estimates do not represent individual company projections.
The revenue breakdown introduces further worries. Lending contributed $281.3 million to the year-on-year segment revenue, accounting for about 77% of SoFi’s overall GAAP revenue growth. Technology Platform revenue declined by 23%.
| Business segment | Q2 revenue | Annual change | Contribution profit | Margin, 2026 vs 2025 |
|---|---|---|---|---|
| Lending | $724.8 million | up 63% | $399.0 million | 55% compared to 55% |
| Financial Services | $466.3 million | up 29% | $212.7 million | 46% versus 52% |
| Technology Platform | $84.5 million | down 23% | $11.8 million | 14% against 30% |
SoFi uses contribution profit as its non-GAAP metric at the segment level.
Financial Services saw continued growth, though its margin dropped by six percentage points. The margin for Technology Platform was cut by more than half. Lending maintained its margin and was responsible for the majority of the revenue rise.
Customer engagement increased, with 51% of new products opened by existing members, up from 35% the previous year. Product numbers climbed 42%, outpacing the 35% growth in membership. Fee-based revenue totaled $472.3 million, accounting for 39% of overall revenue.
Chief Executive Anthony Noto stated, “Spending remains strong, demand remains strong.” He noted that credit results were in line with or better than the firm’s outlook. Reuters
Opinions varied among analysts regarding the strength of the result. KBW’s Tim Switzer described it as a “lower-quality beat,” pointing to the use of the balance sheet. This worry is reflected in the revenue bridge, where lending continued to dominate. MarketWatch
The spotlight moves to credit conditions next week, away from corporate performance. On Monday, the Federal Reserve releases its bank lending survey. Reports on the labor market and consumer credit are due afterward.
| Date and time, EDT | Scheduled release | Main SoFi read-through |
|---|---|---|
| Monday, August 3, 10:00 | ISM manufacturing survey | Trends in business demand and interest rate forecasts |
| Monday, August 3, 14:00 | Federal Reserve bank-lending survey | Credit demand and lending conditions |
| Tuesday, August 4, 10:00 | June job openings | Labor market demand and household stability |
| Wednesday, August 5, 10:00 | ISM services survey | Services and consumer sector performance |
| Friday, August 7, 08:30 | July employment report | Interest rate outlook and credit risk |
| Friday, August 7, 15:00 | June consumer credit | Expansion in household borrowing |
Friday’s early Reuters consensus estimates 83,000 jobs added with unemployment at 4.3%.
A weaker jobs report may reinforce forecasts for interest rate cuts, but it might also heighten worries about consumer credit. Conversely, stronger figures would shift that outlook. Both scenarios are significant for SoFi, given its focus on lending-driven expansion.
Risks: A rise in unemployment may drive up credit losses and suppress demand for loans. Rapid balance-sheet expansion heightens vulnerability to shifts in funding and capital. Persistent weakness in the Technology Platform could postpone the transition to fee-driven income.