NEW YORK, August 1, 2026, 15:01 EDT
- After the $0.56 ex-distribution adjustment on Friday, units ended the session at $38.05.
- Cash reserves nearly equalled capital spending over the quarter. Free cash flow closely approached the amount distributed through payouts and share repurchases.
- Next week, results from Energy Transfer and Western Midstream will provide new comparisons within the sector.
Enterprise Products Partners L.P. NYSE:EPD closed at $38.05 on Friday. With U.S. markets shut over the weekend, the preliminary figure indicated a 1.8% drop for the week. Factoring in the $0.56 distribution, the adjusted decline came to approximately 0.3%.
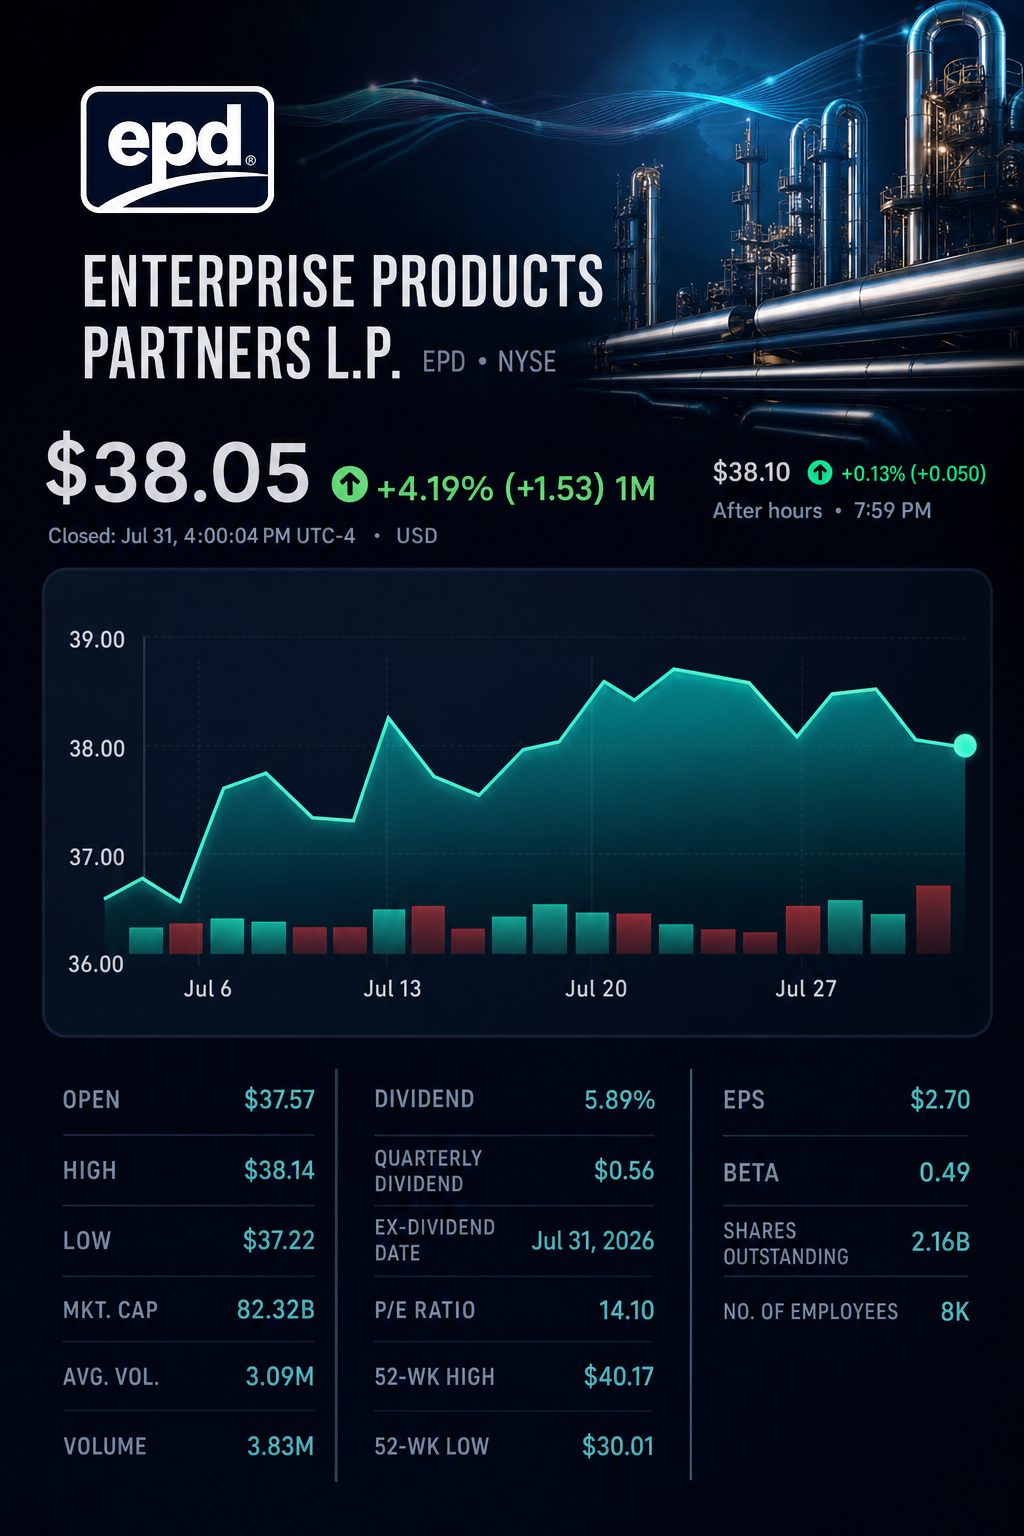
The difference is significant. Shares dropped 1.42% on Thursday following the quarterly results. After Friday’s ex-distribution action, the combined return over the two sessions was roughly unchanged.
| Trading window | Closing-price path | Price move | With $0.56 distribution |
|---|---|---|---|
| Thursday, earnings release | $38.67 → $38.12 | -1.42% | -1.42% |
| Friday, goes ex-distribution | $38.12 → $38.05 | -0.18% | +1.29% |
| From Wednesday’s close | $38.67 → $38.05 | -1.60% | -0.16% |
| Entire week | $38.73 → $38.05 | -1.76% | -0.31% |
Figures are based on regular-session closing prices and the stated quarterly payout.
The bigger highlight was cash generation. Operational distributable cash flow totaled $2.312 billion, with Enterprise holding onto approximately $1.1 billion after making distribution payments. That amount was almost enough to meet $1.138 billion in capital expenditures for the quarter.
| Second-quarter cash item | Amount | Coverage comparison |
|---|---|---|
| Operational distributable cash flow | $2.312 billion | Initial cash metric |
| Cash distributions | About $1.200 billion | Coverage of 1.9 times |
| Cash retained after distributions | About $1.100 billion | Represents around 97% of capital outlays |
| Capital spending | $1.138 billion | Outlay for growth and maintenance |
| Adjusted free cash flow | $1.341 billion | Cash remaining post capital spend |
| Unit repurchases | $159 million | Further capital returned |
| Distributions plus repurchases | About $1.359 billion | Adjusted FCF covers roughly 99% |
Reported coverage percentages are based on rounded figures from company disclosures. Adjusted free cash flow refers to a non-GAAP metric.
Adjusted free cash flow was about $18 million less than total distributions and repurchases, based on the rounded distribution figure. Enterprise’s leverage was 3.0 times at the end of June, with liquidity standing at $4.0 billion.
The quarter saw broad growth. Net income increased by 28%, with adjusted EBITDA up 17%. Adjusted free cash flow advanced 65%.
| Financial measure | Q2 2026 | Q2 2025 | Change |
|---|---|---|---|
| Revenue | $18.269 billion | $11.363 billion | +60.8% |
| Net income attributable to common unitholders | $1.840 billion | $1.435 billion | +28.2% |
| Earnings per unit | $0.84 | $0.66 | +27.3% |
| Adjusted EBITDA | $2.829 billion | $2.408 billion | +17.5% |
| Operational distributable cash flow | $2.312 billion | $1.914 billion | +20.8% |
| Adjusted free cash flow | $1.341 billion | $812 million | +65.1% |
Company-defined non-GAAP metrics include adjusted EBITDA, operational distributable cash flow, and adjusted free cash flow.
Revenue increased by 61%, driven in part by growth in commodity marketing. Enterprise noted that the rise in marketing sales comes with corresponding purchase expenses. As a result, margins and cash figures offered a clearer picture.
Physical throughput saw further improvement. Crude marine shipment volumes climbed 39%, marking the highest increase reported. Marine loadings of NGL advanced 30%.
| Operating measure | Q2 2026 | Q2 2025 | Change |
|---|---|---|---|
| NGL pipeline throughput | 4.913 million bpd | 4.562 million bpd | +7.7% |
| NGL marine throughput | 1.226 million bpd | 942,000 bpd | +30.1% |
| NGL fractionation throughput | 1.858 million bpd | 1.667 million bpd | +11.5% |
| Crude-oil pipeline throughput | 3.025 million bpd | 2.622 million bpd | +15.4% |
| Crude-oil marine throughput | 1.123 million bpd | 811,000 bpd | +38.5% |
| Natural-gas pipeline throughput | 21.048 trillion Btu/day | 20.405 trillion Btu/day | +3.2% |
Company-reported quarterly averages are used to determine volume changes.
“Enterprise saw robust volumes, earnings and cash flow,” said co-Chief Executive A.J. “Jim” Teague. He attributed record pipeline and marine volumes in part to export demand during April and May. According to him, marine operations stabilized to usual levels in June and July. Enterprise Products
The expansion bill is still substantial. Enterprise is currently building major projects totaling $6.5 billion. For 2026, the company projects growth capital in the range of $2.9 billion to $3.4 billion, after accounting for $599 million from asset sales.
The distribution annualizes to $2.24 per unit, providing a yield of 5.89% based on Friday’s closing price. The distribution is up 2.8% from the previous year. According to Enterprise, it has raised distributions for 28 consecutive years.
Two direct sector tests are scheduled for next week. Energy Transfer LP NYSE:ET will report on Tuesday before market open, while Western Midstream Partners LP (NYSE:WES) is due to report after market close on Wednesday. The companies’ Permian volumes and investment plans will help determine if Enterprise’s gains are being matched across the sector.
Risks: The boost in exports was partly driven by short-term disruption in the Middle East. The gross operating margin for the second quarter factored in an additional $77 million from unrealized mark-to-market gains. Any projects running behind schedule or exceeding the $6.5 billion budget could reduce the cash position.
The figures indicate payout coverage is not the pressing limitation. The subsequent challenge is project returns.