NEW YORK, August 2, 2026, 10:08 EDT – Apple shares declined after it emerged that tariff refunds accounted for the majority of its quarterly earnings beat.
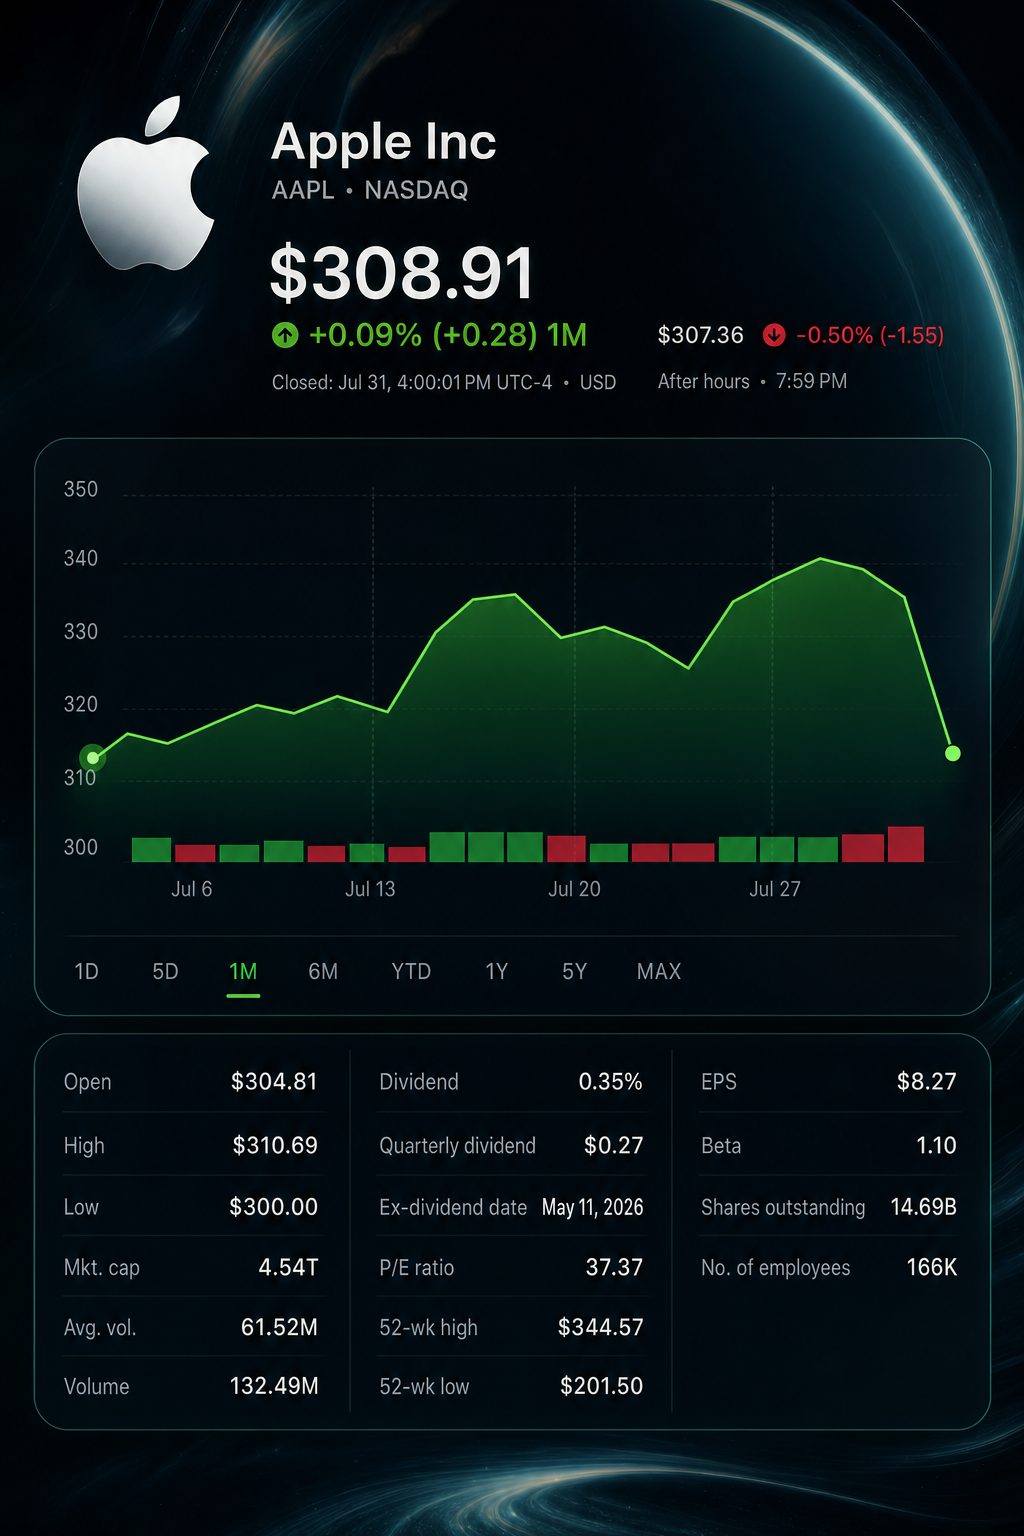
- Apple ended Friday’s session at $308.91, falling nearly 7%. Shares declined 7.2% over the week.
- Tariff reimbursements contributed $0.11 per share, accounting for roughly 85% of the difference with consensus forecasts.
- Apple projected revenue growth for the September quarter at 9% to 11%, below Wall Street expectations of about 12%.
Apple Inc. NASDAQ:AAPL lost about $350 billion in market capitalization on Friday. Despite record iPhone sales, investors raised concerns about the sustainability of the earnings beat. The stock closed at $308.91.
The earnings bridge illustrates the response. Earnings reported came in at $2.02 per share, ahead of the $1.89 expected. Refunds accounted for 11 cents of the 13-cent difference. Core earnings stood at roughly $1.91.
Gross margin followed a similar trend. The reported figure stood at 50.1%, bolstered by a two-point refund benefit. Excluding this, margin amounted to 48.1%, which was just 18 basis points higher than consensus.
| Measure | Reported | Refund effect | Ex-refund or remaining | Street |
|---|---|---|---|---|
| Earnings per share | $2.02 | $0.11 | Roughly $1.91 | $1.89 |
| Gross margin | 50.1% | 2.0 percentage points | 48.1% | 47.92% |
| EPS gap over consensus | $0.13 | $0.11 | $0.02 | — |
| Refund share of EPS gap | — | — | Approximately 85% | — |
The figures are based on Apple’s disclosed data and Reuters consensus forecasts.
Hardware sales were robust. iPhone and Mac results topped expectations. Services and iPad fell short. That combination put extra focus on the softer outlook.
| Fiscal third quarter | Reported | Wall Street estimate | Year-on-year change |
|---|---|---|---|
| Total revenue | $109.42 billion | $108.65 billion | up 16.4% |
| iPhone | $54.25 billion | $53.86 billion | up 21.7% |
| Mac | $10.35 billion | $8.74 billion | up 28.7% |
| Services | $30.74 billion | $31.22 billion | up 12.1% |
| iPad | $6.19 billion | $6.92 billion | down 5.9% |
| Greater China | $18.82 billion | $19.67 billion | up 22.4% |
Reported sales come from Apple filings. Reuters supplied analyst forecasts.
iPhone sales hit a new record for the June quarter. Mac revenue’s increase was driven largely by higher laptop sales. Services revenue grew at a slower pace, rising 12.1% in June after expanding 16.3% in March.
Chief Financial Officer Kevan Parekh pointed to shifts in mobile gaming and modifications to App Store policies. D.A. Davidson analyst Gil Luria said services could “slow down even more” once iPhone expansion levels off. Reuters
Outlook proved pivotal. Apple is forecasting sales for the September quarter to rise between 9% and 11%, while consensus had been around 12%. Growth in iPhone revenues is expected in the mid-teens, trailing the 17.6% analysts had projected. Gross margin is anticipated in the 47% to 48% range.
Chief Executive Tim Cook described the supply constraints as “very significant,” noting Apple had restricted ability to address them. Advanced processor and memory availability remain constrained as AI data centres continue to take up capacity. Reuters
Apple’s inventory reserves were already sizable, with total inventory climbing to $11.09 billion, an increase of 94% from September. Components inventory jumped 260% to $7.65 billion. However, management maintained guidance that remained under consensus.
| Inventory | September 27, 2025 | June 27, 2026 | Change |
|---|---|---|---|
| Components | $2.12 billion | $7.65 billion | Up 260% |
| Finished goods | $3.59 billion | $3.45 billion | Down 4% |
| Total | $5.72 billion | $11.09 billion | Up 94% |
Apple’s quarterly report provides inventory numbers. The percentages reflect changes based on disclosed values.
The broader market headed in the opposite direction. The Nasdaq Composite climbed 1% on Friday. The S&P 500 advanced 0.7%, though Apple dropped roughly 7%.
The decline also altered the ranking of mega-cap stocks.
| Company | Friday move | Market value | Trailing P/E |
|---|---|---|---|
| Apple NASDAQ:AAPL | Down roughly 7.1% | $4.55 trillion | 37.4 |
| Nvidia Corp. NASDAQ:NVDA | Up 3.0% | $4.90 trillion | 30.6 |
| Microsoft Corp. NASDAQ:MSFT | Up 3.0% | $3.46 trillion | 27.7 |
| Alphabet Inc. NASDAQ:GOOGL | Up 6.7% | $4.36 trillion | 17.9 |
Friday’s closing figures and valuation ratios.
Apple’s trailing multiple is 22% higher than Nvidia’s and 35% greater than Microsoft’s. The company’s market capitalisation is now about $348 billion behind Nvidia’s.
Following the results, four brokerages lowered their price targets for Apple, while three increased them. The median price target declined to $330, suggesting a potential 6.8% increase from Friday’s closing price.
U.S. cash markets remain shut on Sunday and will resume trading at 9:30 a.m. EDT on Monday. In the week ahead, investors are set to monitor additional target changes and the $300 intraday low reached on Friday. Updates on supply chains will stay in focus as the main gauge.
Risks exist in both directions. Speedier improvement in supply or higher iPhone pricing may drive a rebound in shares. Ongoing memory inflation, continued App Store softness or demand brought forward ahead of price hikes could weigh on earnings forecasts.
Related articles: NASDAQ:AAPL