
NEW YORK, August 1, 2026, 10:09 EDT
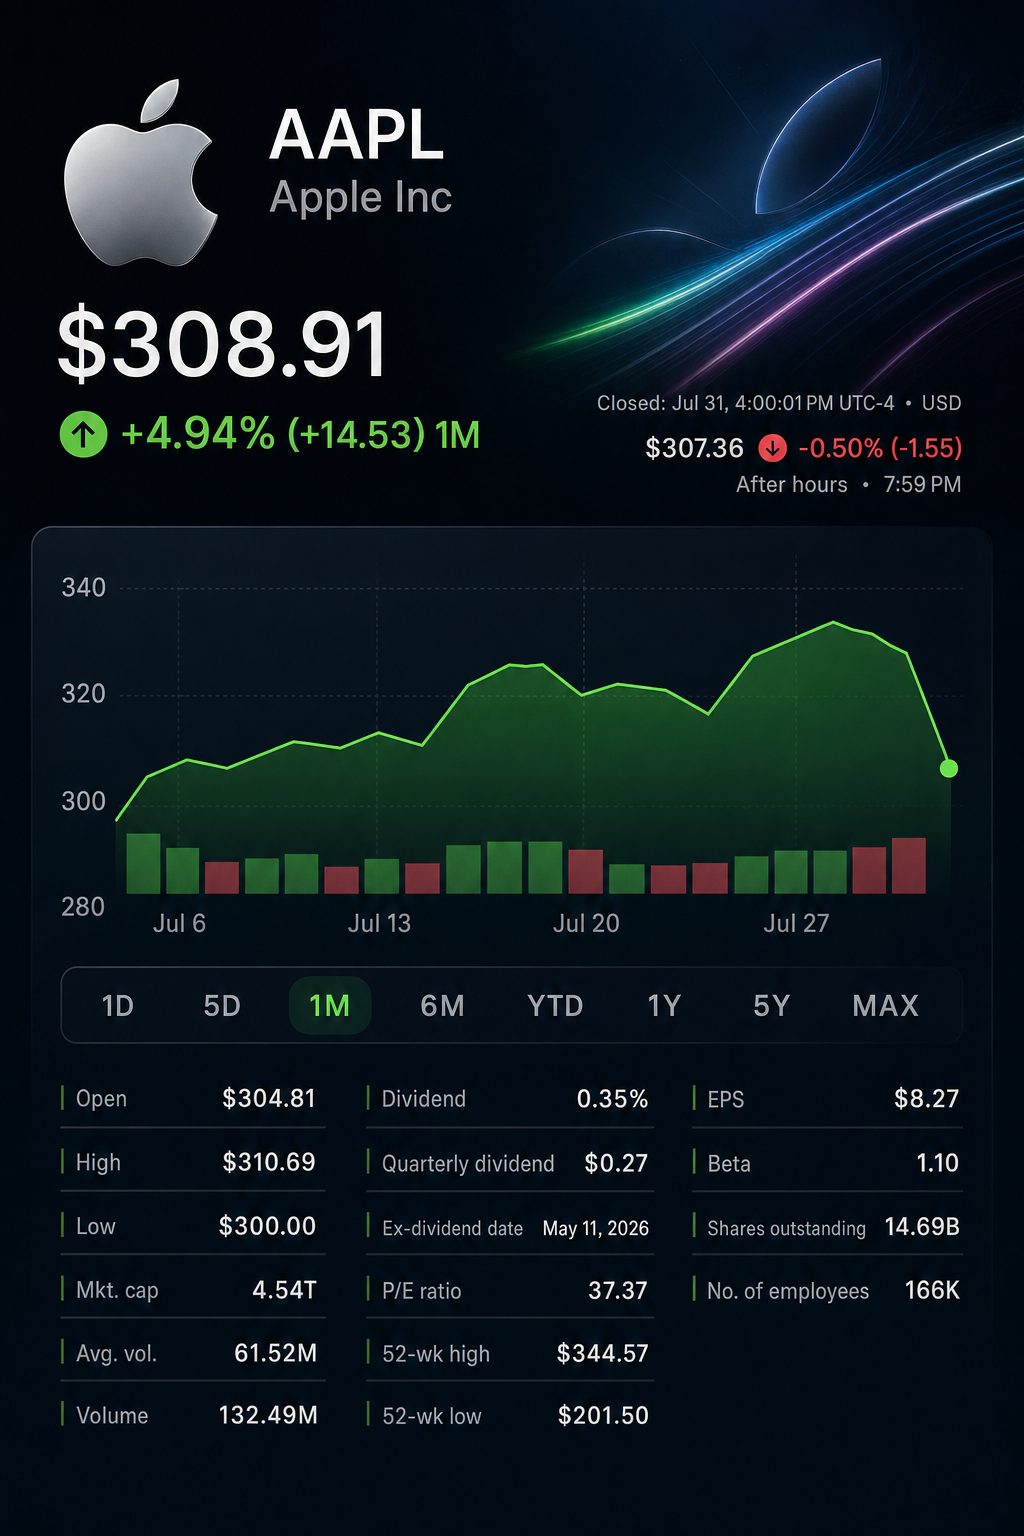
- Apple shares ended Friday at $308.91, falling 7.35% and wiping out approximately $358 billion in market capitalization.
- Refunds from tariffs contributed $0.11 per share to earnings, accounting for about 85% of the 13 cent beat.
- Guidance for revenue growth in the September quarter was set at 9%-11%, missing Wall Street’s forecast of 12%.
U.S. financial markets did not trade on Saturday. Apple shares finished Friday at $308.91, falling 7.35%. The decline wiped out approximately $358 billion in value. Over the week, the stock dropped 7.2%, while the Nasdaq advanced 1.6%.
The decline focused on the quality of earnings. Apple posted earnings of $2.02 per share, surpassing the consensus estimate of $1.89. Refunds from tariffs accounted for 11 cents of that figure. Without including those refunds, the earnings beat narrowed to just two cents, approximately 15% of the reported surprise.
Margins reflected similar trends. Gross margin was reported at 50.1%, factoring in two points related to refunds. The core outcome slightly surpassed forecasts.
Earnings quality reconciliation
| Metric | Reported or guided | Adjusted or calculated | Comparison |
|---|---|---|---|
| Fiscal Q3 EPS | $2.02 | $1.91 without refund impact | $1.89 consensus |
| Fiscal Q3 EPS surprise | $0.13 | $0.02 excluding refund | Refund accounted for 84.6% |
| Fiscal Q3 gross margin | 50.1% | 48.1% after refund removed | 47.92% consensus |
| September-quarter margin | 47%-48% outlook | 47.5% midpoint | Down 60 bps from Q3 excluding refund |
Source: Apple and Reuters. All figures for adjustments and basis-point comparisons are computed.
Sales momentum stayed robust. Revenue increased by 16.4% to $109.42 billion. Tim Cook described it as an “incredibly strong product cycle beyond our expectations.” iPhone, Mac and services each achieved record June-quarter sales. Reuters
Breakdown of revenue
| Revenue line | Q3 sales | Year-on-year change | Share of revenue |
|---|---|---|---|
| iPhone | $54.25 billion | up 21.7% | 49.6% |
| Services | $30.74 billion | up 12.1% | 28.1% |
| Mac | $10.35 billion | increase of 28.7% | 9.5% |
| Wearables, Home and Accessories | $7.88 billion | gain of 6.5% | 7.2% |
| iPad | $6.19 billion | decline of 5.9% | 5.7% |
Source: Apple’s preliminary quarterly reports. Calculations for growth and revenue portion.
Services make up a larger share of overall profit. Disclosed costs indicate a 75.6% gross margin for services, compared to 40.1% for products. Gil Luria at D.A. Davidson stated that services might “slow down even more” as iPhone growth steadies.
Performance was mixed compared to consensus. Mac achieved the strongest outperformance. iPad, services, and Greater China fell short. Despite this, Greater China posted 22.4% growth, though forecasts had anticipated more.
Consensus compared to actual
| Metric | Actual | Wall Street estimate | Variance |
|---|---|---|---|
| Mac revenue | $10.35 billion | $8.74 billion | +18.4% |
| iPhone revenue | $54.25 billion | $53.86 billion | +0.7% |
| Services revenue | $30.74 billion | $31.22 billion | -1.5% |
| Greater China revenue | $18.82 billion | $19.67 billion | -4.3% |
| iPad revenue | $6.19 billion | $6.92 billion | -10.5% |
Information: Reuters, based on analyst projections from LSEG and Visible Alpha. Discrepancies are computed values.
Management is projecting revenue growth between 9% and 11% for the September quarter. Analysts on Wall Street had anticipated roughly 12%. The forecast for margins is at 47%-48%, which is 60 basis points under the ex-refund margin result from Q3 at the midpoint.
Cook stated that supply limitations were “very significant,” with minimal room for adjustment. The primary bottlenecks affected advanced processor and memory capacity. According to Reuters, Apple’s inventory reserves were dwindling. Reuters
The market showed a strong divergence. Amazon NASDAQ:AMZN advanced 15.3%, Alphabet NASDAQ:GOOGL climbed 6.7%, and Microsoft NASDAQ:MSFT edged up 3.0%. The Nasdaq ended the session up 1%.
Friday peer overview
| Company | Closing price | Friday move | Market value | P/E ratio |
|---|---|---|---|---|
| Apple | $308.91 | down 7.35% | $4.54 trillion | 37.4 |
| Amazon | $271.58 | up 15.32% | $2.92 trillion | 32.5 |
| Alphabet | $356.13 | rose 6.73% | $4.35 trillion | 17.9 |
| Microsoft | $464.72 | increased 3.02% | $3.45 trillion | 27.7 |
Information provided by Google Finance and Associated Press.
Apple’s price-to-earnings ratio of 37.4 stayed higher than each of its main competitors. That valuation means another disappointment would come at a greater price. Analysts’ median target price was $330, or roughly 6.8% higher than where shares finished on Friday.
The July U.S. employment data is due on Friday, August 7. Apple shareholders will monitor updates from brokers and inspection of supply chain components. The company’s $0.27 dividend record date is set for August 10.
Risks: Supply constraints may resolve more quickly, enabling Apple to address backlogged demand and maintain margins. Potential downside issues are more severe processor shortages, weaker services performance, and increased pressure on the App Store.
Related articles: NASDAQ:AAPL








![Australia Stock Market Today 08.22.2026 [UPDATE: 08.22.2026 08:37 AEST] [Weekly Recap and Week Ahead: Healthcare Leads, CPI Looms]](https://ts2.tech/wp-content/uploads/2026/08/AU-market-dashboard-2026-08-22-0837-480x384.jpg "Australia Stock Market Today 08.22.2026 [UPDATE: 08.22.2026 08:37 AEST] [Weekly Recap and Week Ahead: Healthcare Leads, CPI Looms]")