
NEW YORK, August 6, 2026, 07:02 EDT
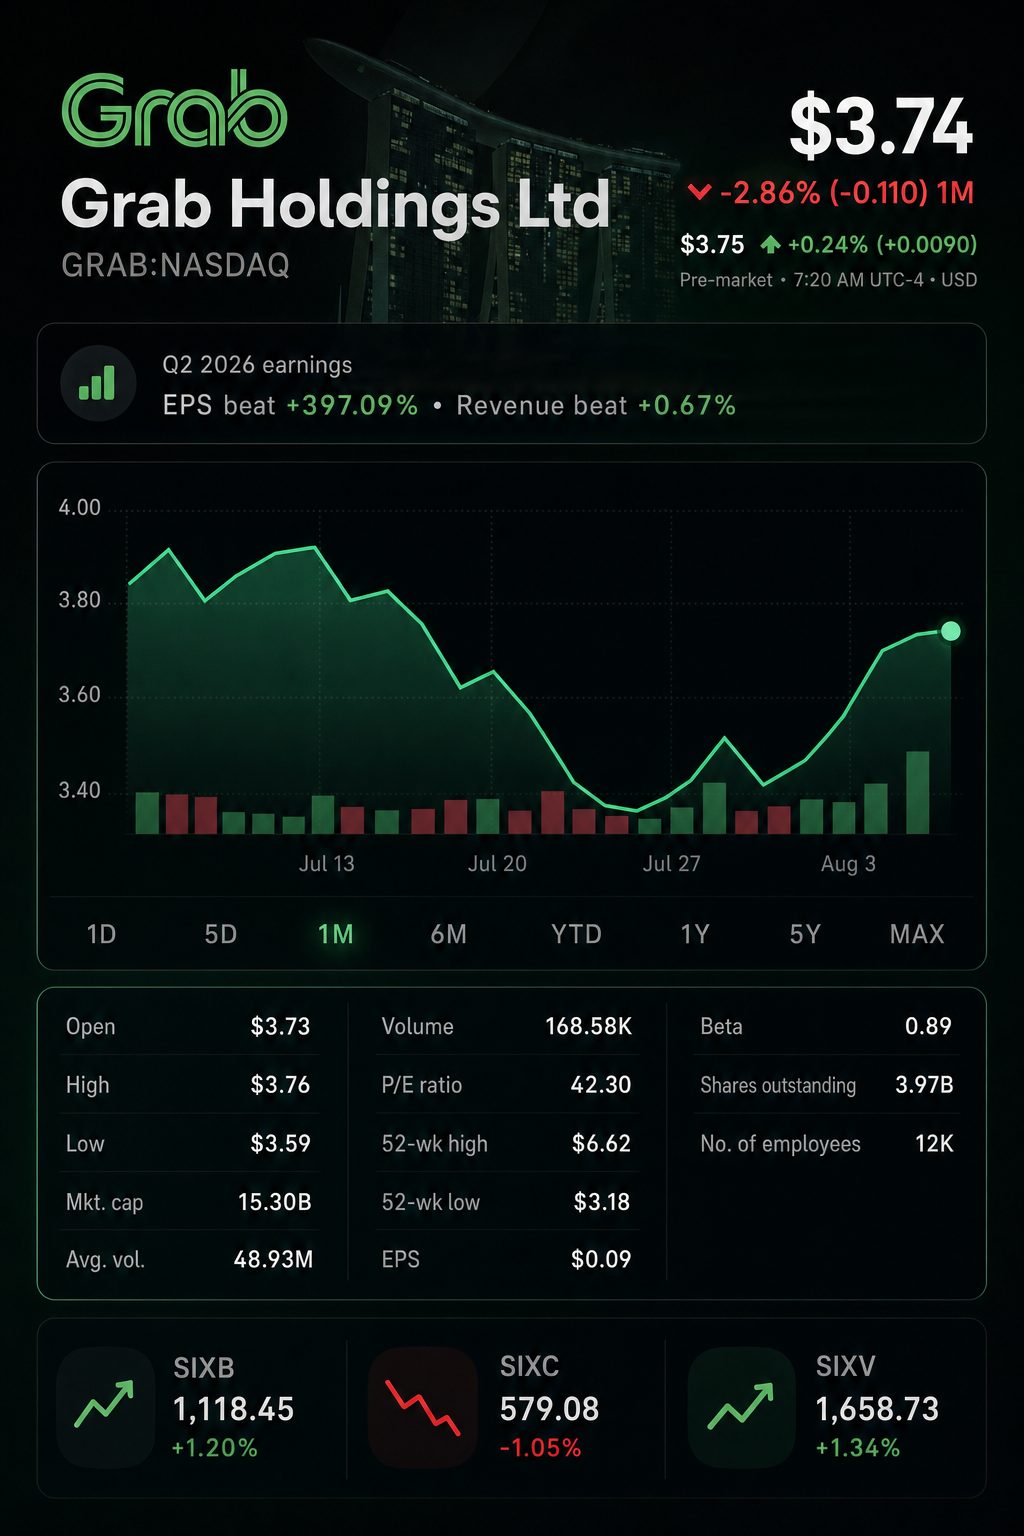
- Grab was last trading near $3.74 ahead of the U.S. market open. The regular cash session had not yet started.
- The latest share repurchase represents approximately 5.1% of the company’s market capitalization and is 1.7 times greater than its latest adjusted free cash flow.
- Revenue for the second quarter increased by 22%, while adjusted EBITDA rose 54%. Adjusted free cash flow for the quarter was down 35%.
Grab Holdings Limited NASDAQ:GRAB sent a stronger message on capital returns than on improved forecasts. The company introduced a new $750 million share buyback, equal to roughly 5.1% of its market capitalisation. In contrast, its revenue guidance midpoint advanced by 1.4%, while the midpoint for adjusted EBITDA climbed 2.8%.
The key focus for investors is that difference. Grab has $5.4 billion in net cash available to finance the programme. The buyback authorization amounts to 13.9% of this cash total and is 1.7 times trailing adjusted free cash flow. Still, the company is under no obligation to repurchase a specific quantity of shares.
Scale of capital returns
| Measure | Value | Investor read-through |
|---|---|---|
| Current market capitalization | $14.78 billion | Benchmark figure |
| New repurchase authorization | $750 million | 5.1% of the company’s value |
| Net cash liquidity, June 30 | $5.40 billion | Buyback represents 13.9% |
| Trailing adjusted free cash flow | $450 million | Buyback is 1.7 times FCF |
| Illustrative enterprise value | $9.38 billion | Calculated as market cap minus net cash |
| Illustrative 2026 EV/adjusted EBITDA | 12.9 times | Mid-range guidance of $730 million applied |
Figures are based on Thursday’s market capitalisation and Grab’s unaudited liquidity data from June.
The company’s valuation sheds light on upbeat analyst sentiment. Macquarie Group ASX:MQG projected roughly 13 times 2026 enterprise value to adjusted EBITDA as well. However, Grab ended trading on Wednesday at $3.74, just 1.9% higher than its close ahead of results on Monday. On Tuesday, shares jumped as high as $3.97 before retreating.
The core quarter delivered robust results. Revenue came in at $997 million, surpassing analyst consensus by approximately 0.6%. On-demand gross merchandise value climbed 21%. Adjusted EBITDA rose for the eighteenth quarter in a row.
Q2 operations report
| Metric | Q2 2026 | Year-on-year change | Additional context |
|---|---|---|---|
| Revenue | $997 million | +22% | Market estimate stood at $990.8 million |
| On-demand GMV | $6.5 billion | +21% | Increase in constant currency was 22% |
| Monthly transacting users | 54 million | +17% | New high |
| Adjusted EBITDA | $168 million | +54% | Margin increased to 16.9% |
| Adjusted free cash flow | $73 million | -35% | Previous rolling total was $450 million |
Figures are preliminary and unaudited. The reported $39 million drop is used to determine the decrease in free cash flow.
Profit growth outpaced cash conversion. Adjusted free cash flow for the quarter declined to $73 million from $112 million. Grab attributed this to increased capital spending and a decrease in operating cash flow. As a result, the buyback will rely more heavily on the balance sheet than on that quarter’s cash flow.
Reported net income was $235 million, bolstered by a $307 million gain from Superbank remeasurement and a $66 million deferred tax benefit. Stripping out these effects, operating profit stood at just $19 million.
Management lifted full-year forecasts, though the adjustments were cautious. The midpoint for revenue climbed by $55 million and the midpoint for adjusted EBITDA advanced by $20 million. The implied midpoint margin gained approximately 25 basis points.
2026 outlook comparison
| Measure | Previous guidance | New guidance | Midpoint change |
|---|---|---|---|
| Revenue | $4.04–$4.10 billion | $4.10–$4.15 billion | +1.4% |
| Adjusted EBITDA | $700–$720 million | $720–$740 million | +2.8% |
| Implied midpoint EBITDA margin | 17.44% | 17.70% | +25 basis points |
The midpoint percentages use Grab’s stated ranges as their basis for calculation.
Core platform growth was driven by deliveries. Revenue climbed 21% to $531 million. GMV in constant currency advanced 24%, and segment margin expanded by 45 basis points. The increase was fueled by advertising and operating leverage.
Mobility continued as the top profit driver, posting a 12% increase in revenue, though margin narrowed by nine basis points. Financial services registered the highest growth, as revenue climbed 59% and the gross loan portfolio almost tripled.
Comparison of segments
| Segment | Revenue | Revenue growth | Main scale measure | Segment adjusted EBITDA | Margin |
|---|---|---|---|---|---|
| Deliveries | $531 million | +21% | $4.25 billion GMV, up 24% on constant currency | $96 million | 2.3%, increased by 45 bps |
| Mobility | $331 million | +12% | $2.21 billion GMV, up 18% | $191 million | 8.6%, decreased by 9 bps |
| Financial services | $134 million | +59% | $2.32 billion loan portfolio, rose 197% | -$15 million | Loss reduction of $11 million |
Segment adjusted EBITDA does not include regional corporate expenses.
Expansion demanded increased backing. Aggregate incentives totaled $706 million. On-demand incentives made up 10.9% of GMV, a rise of 72 basis points. Grab also allocated over $7 million to support drivers, contributing to a 19% growth in active drivers. “We know our ASEAN customers are watching their wallet,” Chief Financial Officer Peter Oey told Reuters. Grab
Efficiencies driven by AI helped ease some costs. Oey noted Grab had managed to accelerate product shipments to three times their previous speed and removed close to 40,000 hours of sales inefficiency. However, regional corporate expenses increased by $12 million to reach $104 million, largely due to higher spending on cloud services and software.
Financial services is the key variable for the second half. The company anticipates this segment will achieve positive adjusted EBITDA and that the loan portfolio will surpass $3 billion by year-end. Management noted non-performing loan ratios held steady. Stash will start to be included in the reported results from the third quarter.
Following the release, analysts maintained a positive stance. Out of 26 analysts surveyed, the consensus was rated as Strong Buy with an average price target of $5.86. This represents potential upside of about 57% compared to Wednesday’s closing price, though forecasts among analysts showed significant divergence.
Analyst ratings
| Firm | Date | Recommendation | New target | Previous target | Implied upside from $3.74 |
|---|---|---|---|---|---|
| Macquarie Group ASX:MQG | Aug. 5 | Outperform | $5.55 | $5.31 | 48% |
| Bernstein SocGen Group EPA:GLE | Aug. 4 | Outperform | $5.90 | $5.80 | 58% |
| Evercore Inc. NYSE:EVR | Aug. 4 | Outperform | $8.00 | $8.00 | 114% |
Upside percentages are based on Grab’s closing price as of August 5.
Grab shares rose 11.6% during the five sessions ending Wednesday, with the majority of gains occurring before the company posted its earnings report. Looking forward, investors are expected to focus more on share buyback activity, quarterly free cash flow, and mobility segment margins, rather than the incremental upward revision in guidance.
Risks persist. Incentives became more aggressive, mobility margins compressed and the loan book grew by 197%. The share buyback programme may be postponed or downsized. Reported earnings could fluctuate due to fair value adjustments and various non-operating factors.
The investment outlook has changed. While another GMV beat is positive, it is insufficient on its own. Grab now needs to turn its cash reserves into a smaller share count, while maintaining strict lending standards and protecting free cash flow.
Related articles: NASDAQ:GRAB