
NEW YORK, August 10, 2026, 08:05 EDT
- CoreWeave gained 26.3% over the previous week. Options anticipate an approximately 13% swing following earnings by Friday.
- The initial estimate for second-quarter revenue stands at $2.56 billion, reflecting just a 1.4% increase over the midpoint of management’s guidance.
- Based on guidance midpoints, interest expenses are 11.5 times adjusted operating income. Capital expenditures represent 3.1 times projected quarterly revenue.
CoreWeave faces a tougher challenge beyond sales outperformance as it heads into Tuesday’s results. Its stock surged 26.3% last week, doubling the movement implied by options.
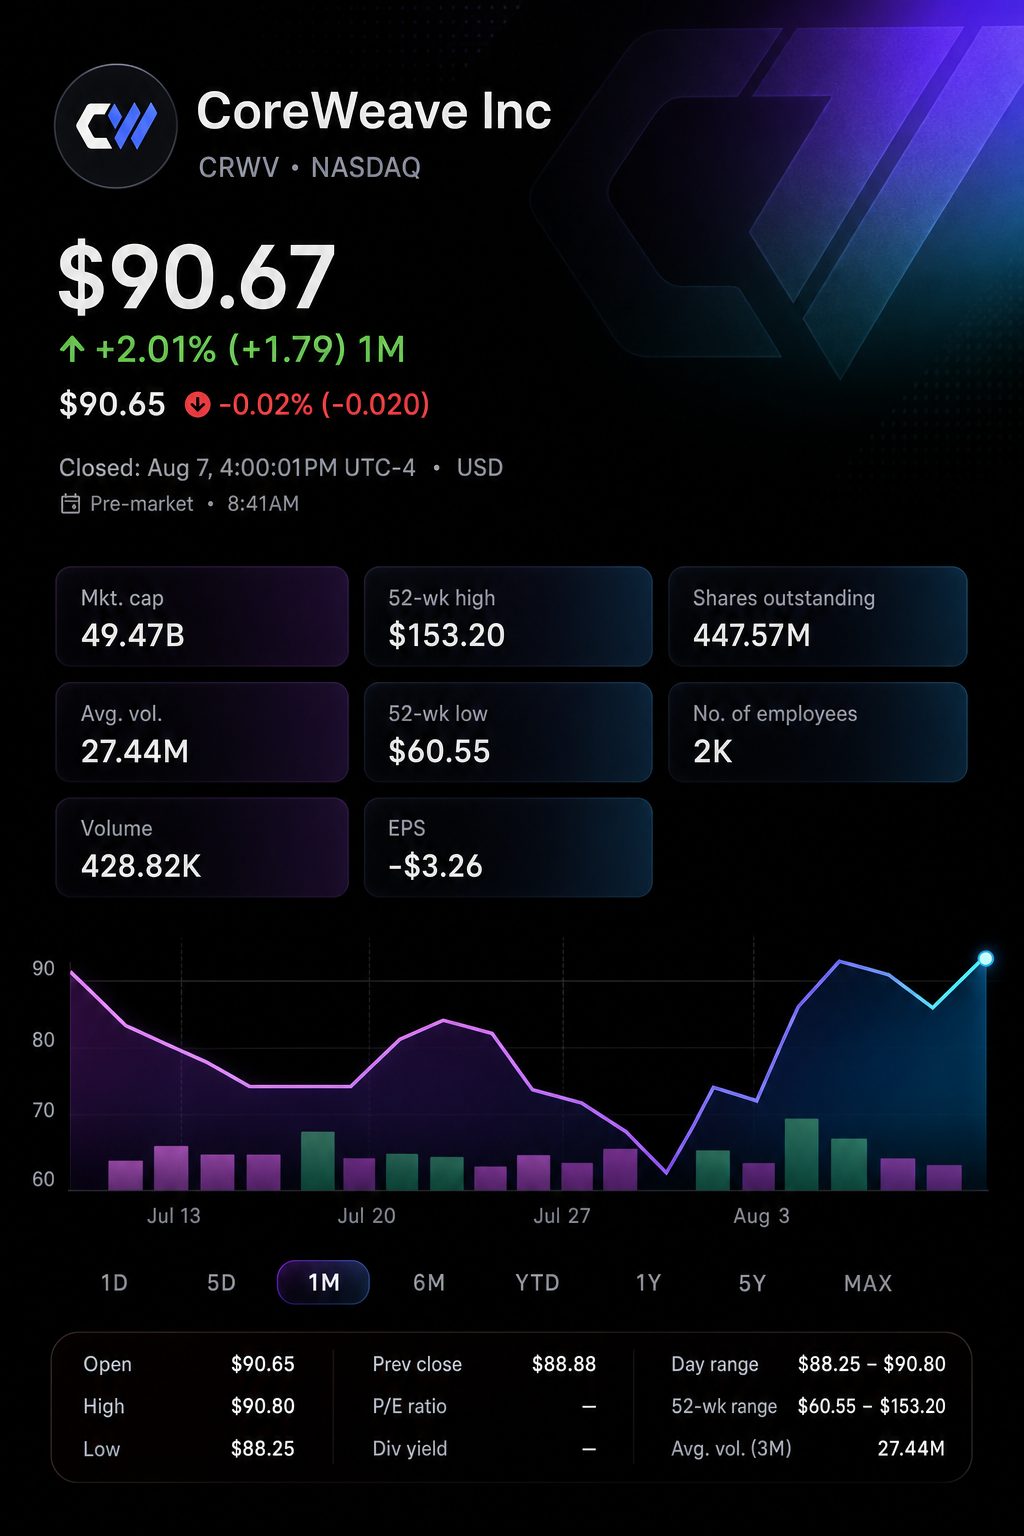
The U.S. cash market remained closed. CoreWeave was quoted at $91.80 as of 7:58 a.m. EDT, showing a 1.25% rise from Friday’s closing price.
The main difference lies in expectations. Visible Alpha’s early estimate for sales is $2.56 billion, just 1.4% higher than CoreWeave’s $2.525 billion midpoint guidance.
This gives scant margin for a routine beat. Investors are looking for proof that increased power and improved hardware deliver stronger margins.
| Market measure | Value | Investor context |
|---|---|---|
| Friday closing price | $90.67 | Gained 6.3% during the session |
| Previous week | +26.3% | Roughly double the options-implied shift |
| Options-implied earnings move | ±13% | Expected through Friday |
| Calculated post-report range | $78.88–$102.46 | Derived using Friday’s closing value |
| Monday premarket indication | $91.80 | Higher by 1.25% at 7:58 a.m. EDT |
The figures are based on Friday’s closing price and the referenced options projection.
The range spans widely, though it stops short of a complete reset. The lower limit is still higher than the July 31 closing price of $71.77, while the upper limit is still beneath the June 22 closing price of $111.29.
CoreWeave posted first-quarter revenue at $2.078 billion, with adjusted operating income totaling $21 million. Net interest expense came in at $536 million, and net loss totaled $740 million.
| Financial measure | Q1 2026 actual | Q2 2026 guidance or estimate | Midpoint implication |
|---|---|---|---|
| Revenue | $2.078 billion | $2.45–$2.60 billion guidance | $2.56 billion initial midpoint |
| Adjusted operating income | $21 million | $30–$90 million | $60 million; margin near 2.4% |
| Interest expense | $536 million | $650–$730 million | $690 million |
| Capital spending | $7.695 billion in property and equipment purchases | $7–$9 billion | $8 billion |
Reported results are provided for Q1, while Q2 market estimates are still initial.
At the halfway point of the second quarter, interest expense stands at 11.5 times the company’s adjusted operating income. Projected capital expenditures are 3.1 times the anticipated revenue. As a result, operating leverage is the key factor.
The backlog underpins a positive outlook. CoreWeave closed March holding $99.4 billion in contracted revenue alongside over one gigawatt of active power. Chief Executive Michael Intrator described it as “the strongest bookings quarter in CoreWeave’s history.” CoreWeave
Bank of America Corp. NYSE:BAC analysts commented that “the key debate is less about demand and more about execution.” Oppenheimer Holdings Inc. (NYSE:OPY) analysts Param Singh and Jake Heimowitz described capacity-delay worries as “overblown.” Investopedia
Long-term sentiment is still positive. FactSet Research Systems Inc. NYSE:FDS has 28 analysts rating the stock positively, 12 with hold recommendations, and two with negative views.
| Analyst source | Recommendation or rating mix | Target | Upside from $90.67 |
|---|---|---|---|
| FactSet aggregate | Consensus rates overweight | $138.37 average | 52.6% |
| Visible Alpha aggregate | 11 rate Buy, 3 Neutral | Roughly $147 average | 62.1% |
| Oppenheimer — Singh and Heimowitz | Outperform | $150 | 65.4% |
| Piper Sandler Companies NYSE:PIPR — James Fish | Overweight | $151 | 66.5% |
Target upside is based on Friday’s closing price. The targets reflect longer-term outlooks and do not pertain specifically to the earnings week.
The targets surpass the options ceiling by a significant amount. They rely on CoreWeave converting its backlog, bringing new capacity online, and widening margins across several quarters.
This week offers three key sector gauges. Nebius Group N.V. NASDAQ:NBIS will provide a read on neocloud demand. Lumentum Holdings Inc. NASDAQ:LITE and Applied Materials Inc. NASDAQ:AMAT will indicate trends in optical and chip-equipment expenditures.
| Company | Reporting schedule | Main investor focus |
|---|---|---|
| CoreWeave | Tuesday after market close; call at 5 p.m. ET | Utilization, margin levels, capital expenditures |
| Lumentum | Tuesday after market close | Demand and cost trends for optical components |
| Nebius | Wednesday pre-market | Growth of Neocloud, increased deployment |
| Applied Materials | Thursday after market close | Investment in semiconductors related to AI |
CoreWeave initiates the earnings cycle with its call. Upcoming results will indicate if demand continues to be strong throughout the infrastructure sector.
Risks: Setbacks such as data-center delays, rising component costs or slower rollout by customers could impact revenues and profitability. CoreWeave’s debt load amplifies risks if there is any miss. The options market reflects how swiftly shares could adjust on softer outlook.
The optimal outcome features revenue at the upper end of the guidance range and improved operating income. Executives must also uphold their forecasts for full-year revenue between $12 billion and $13 billion, along with capital expenditures ranging from $31 billion to $35 billion. Relying solely on revenue will not resolve the trade.
Related articles: NASDAQ:CRWV