LIVINGSTON, New Jersey, August 11, 2026, 12:55 EDT
- CoreWeave stock gained 1.2% ahead of the release of its second-quarter results, scheduled after the close.
- Analysts on Wall Street predict revenue will rise over twofold to reach $2.56 billion.
- Infrastructure spending in the first quarter was 3.70 times higher than the revenue for the period.
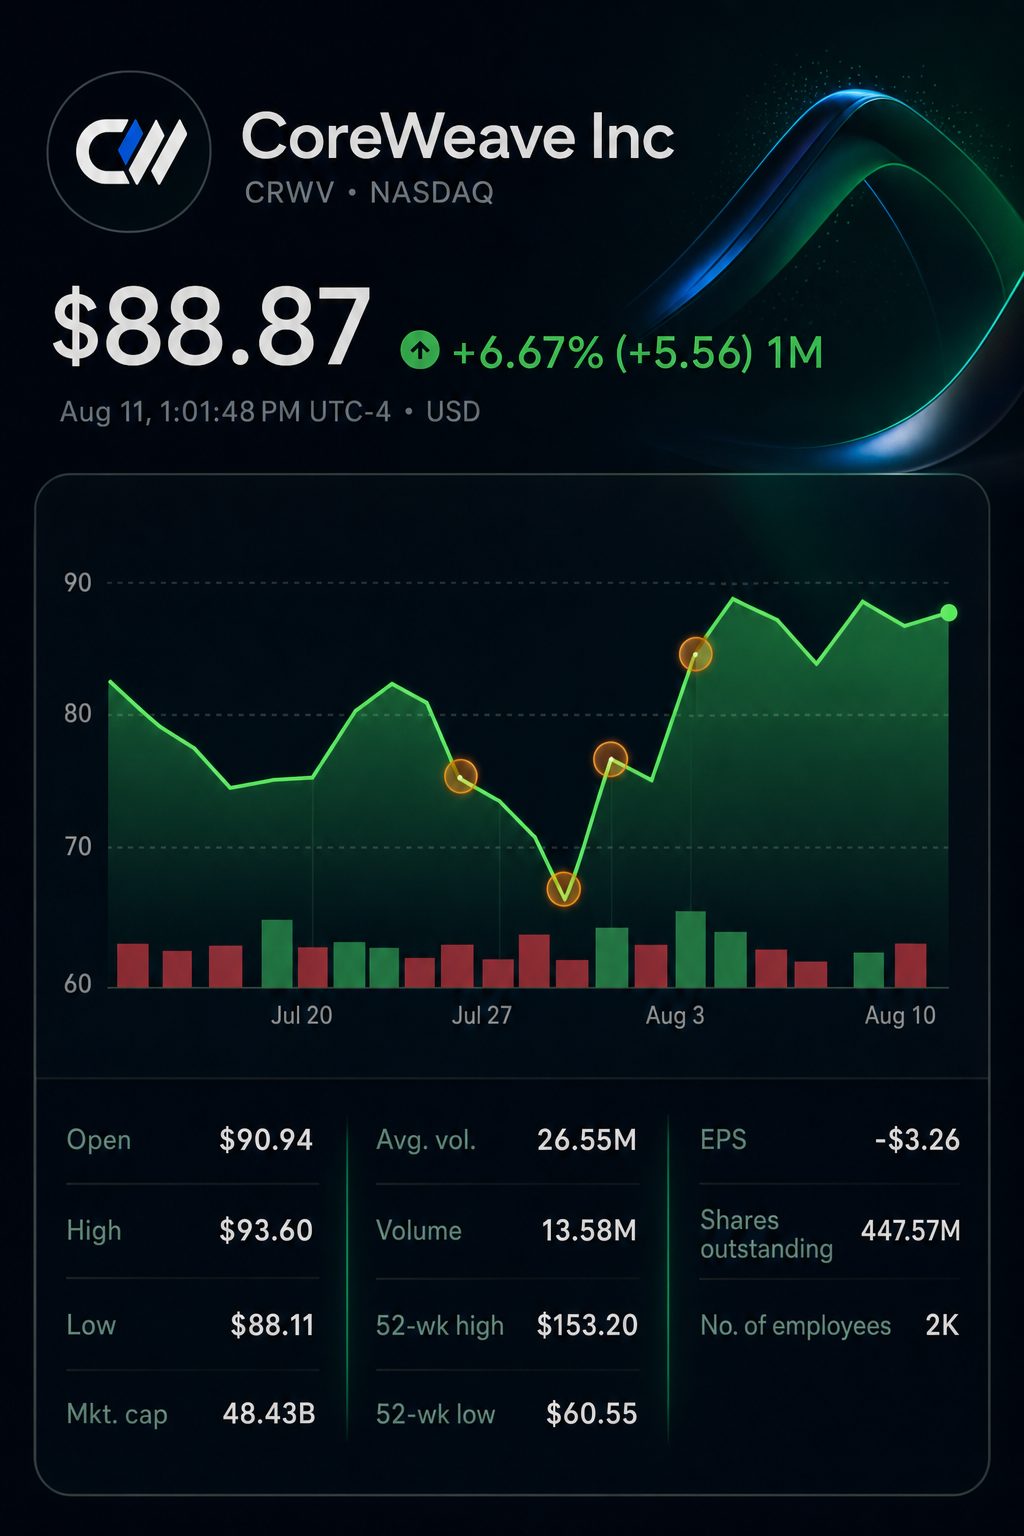
Shares of CoreWeave Inc. NASDAQ:CRWV gained 1.2% on Tuesday ahead of its second-quarter earnings release, which is scheduled after the market closes. Analysts project revenue of $2.56 billion and anticipate a per-share loss of $1.20.
The sales projection suggests yearly growth of 111.6%. However, demand is now just one factor. Investors require evidence that CoreWeave is able to convert its $99.4 billion backlog into output, while ensuring that financing costs do not offset these gains.
That part is more difficult.
| Tuesday market snapshot | Value |
|---|---|
| CoreWeave closing price | $89.26 |
| Change during session | +1.21% |
| Trading day range | $88.11-$93.60 |
| Total shares traded | 13.19 million |
| Market capitalization | $48.66 billion |
| Consensus analyst price target | $128.94 |
| Potential target gain | 44.46% |
At 12:42 EDT, CoreWeave was trading at $89.26, an increase from Monday’s $88.20 close. Trading volume was roughly 50% of its daily average. The target upside is based on the current share price.
The increase trailed behind AI-cloud competitor Nebius Group N.V. NASDAQ:NBIS, which rose 3.5%. Server manufacturer Super Micro Computer Inc. NASDAQ:SMCI was flat ahead of its results.
| AI infrastructure shares | Price | Tuesday move |
|---|---|---|
| CoreWeave NASDAQ:CRWV | $89.26 | up 1.21% |
| Nebius Group NASDAQ:NBIS | $190.60 | rising 3.53% |
| Super Micro Computer NASDAQ:SMCI | $31.49 | gained 0.10% |
The peer comparison is based on intraday quotes aligned between 12:35 and 12:46 EDT. Nebius recorded the sharpest increase, while CoreWeave’s advance stayed limited ahead of the report.
| Earnings test | Q2 2025 actual | Q1 2026 actual | Q2 2026 estimate |
|---|---|---|---|
| Revenue | $1.21 billion | $2.078 billion | $2.56 billion |
| Change from Q2 2025 | – | – | up 111.6% |
| Change from Q1 2026 | – | – | rises 23.2% |
| Earnings per share | -$0.27 | -$1.40 | -$1.20 |
The consensus forecast of $2.56 billion represents an increase of $482 million from the previous quarter and is more than double compared with a year earlier. Estimates are provided by Google Finance, and CoreWeave’s statement verifies the outcome for the March quarter.
Chief Executive Michael Intrator stated, “This was the strongest bookings quarter in CoreWeave’s history, with revenue backlog reaching nearly $100 billion.” As of March 31, backlog stood at $99.4 billion. CoreWeave
The backlog is currently 38.8 times the projected second-quarter sales. This ratio does not represent a schedule for revenue. Contracts remain contingent on CoreWeave providing and maintaining capacity.
| Capital-intensity measure | Q1 2026 | Q1 2025 | Change |
|---|---|---|---|
| Revenue | $2.078 billion | $982 million | +111.6% |
| Property and equipment purchases | $7.695 billion | $1.407 billion | +446.9% |
| Purchases as a multiple of revenue | 3.70 times | 1.43 times | +2.27 times |
| Net interest expense | $536 million | $264 million | +103.0% |
| Interest as share of revenue | 25.8% | 26.9% | -1.1 points |
| Adjusted EBITDA margin | 56% | 62% | -6 points |
In the first quarter, infrastructure spending outpaced revenue growth by a factor of four. CoreWeave allocated $7.695 billion towards property and equipment, representing $3.70 per dollar of revenue. These figures are based on the company’s cash-flow statement.
Net interest expense rose to $536 million, doubling from before. It accounted for 25.8% of revenue, but that proportion declined modestly. The adjusted EBITDA margin decreased by six points to 56%.
CoreWeave financed construction through debt and strategic investment. NVIDIA Corp. NASDAQ:NVDA contributed $2 billion in the first quarter. The firm also obtained an $8.5 billion delayed-draw term loan.
| Analyst | Firm | Rating | Target | Date |
|---|---|---|---|---|
| Samik Chatterjee | JPMorgan Chase & Co. NYSE:JPM | Hold | $110 | Aug. 11 |
| Brad Zelnick | Deutsche Bank AG NYSE:DB | Buy | $150 | Aug. 7 |
| Tyler Radke | Citigroup Inc. NYSE:C | Buy | $142 | Aug. 5 |
| James Fish | Piper Sandler Companies NYSE:PIPR | Buy | $151 | Aug. 4 |
| Michael Turrin | Wells Fargo & Co. NYSE:WFC | Buy | $155 | Aug. 3 |
| Madison Rezaei | AllianceBernstein Holding L.P. NYSE:AB | Sell | $67 | July 30 |
Analyst opinions show considerable divergence. Google Finance lists 13 Buy ratings, four Holds and one Sell. Price targets range between $67 and $167, implying a downside of 24.9% to a potential 87.1% upside.
Risks: Delays in data center projects may postpone revenue, while ongoing interest and depreciation persist. High customer concentration and reliance on NVIDIA systems increase the impact of shifts in supply, pricing, or contract timing.
The 5:00 p.m. EDT earnings call needs to indicate if capital efficiency has increased. Revenue surpassing $2.56 billion would signal sustained demand. However, if margins drop or infrastructure expenditures jump significantly again, financing risk will remain a key concern for the stock.
Related articles: NASDAQ:CRWV