
NEW YORK, August 17, 2026, 15:27 EDT
- SCHD was last changing hands around $34.35, down roughly 0.5% from its close on Friday.
- With a 24.03% year-to-date return through July, it outperformed the large-value category by 9.69 points.
- Analyst targets based on holdings now suggest limited potential for capital gains.
The Schwab U.S. Dividend Equity ETF NYSEARCA:SCHD fell on Monday following a 24% year-to-date advance that brought the ETF near overall analyst target levels. Shares hovered around $34.35, compared to Friday’s closing price of $34.52, with U.S. cash markets still in session.
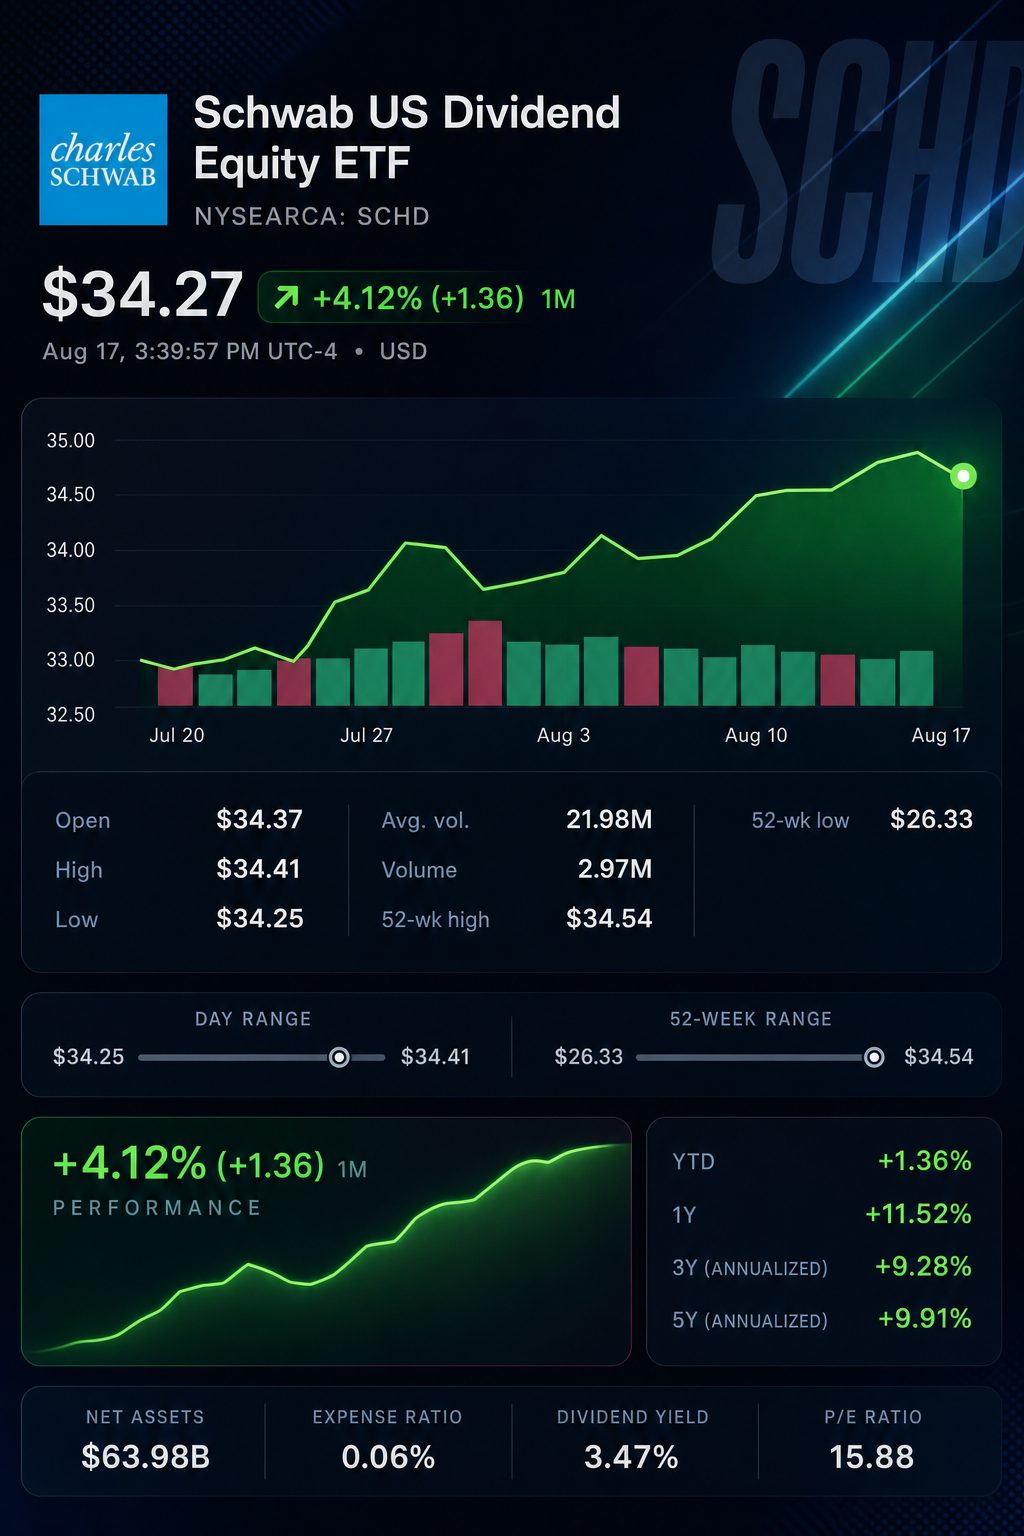
The decline was minor, but the shift in valuation was significant. SCHD’s 2026 gains have narrowed the cushion for capital gains, despite its yield staying above 3%.
| Fund snapshot | Latest verified figure | Date |
|---|---|---|
| Market price | $34.35 | Aug. 17 |
| Previous close | $34.52 | Aug. 14 |
| Net assets | $109.19 billion | Aug. 14 |
| 30-day SEC yield | 3.18% | Aug. 13 |
| Expense ratio | 0.06% | Current |
| Total holdings | 103 | Aug. 14 |
Schwab states that the fund aims to “track as closely as possible” the Dow Jones U.S. Dividend 100 Index, excluding fees. The index is filtered for dividend quality and fundamental strength. As a result, the portfolio reported a 27.08% return on equity and an 18.69 price-to-earnings ratio at the end of July. Schwab Asset Management
| Total return | SCHD | Large-value category | SCHD lead/(lag) |
|---|---|---|---|
| One month | 5.55% | 2.77% | 2.78 pts |
| Three months | 5.20% | 6.03% | (0.83) pts |
| 2026 year to date | 24.03% | 14.34% | 9.69 pts |
| One year | 30.92% | 23.92% | 7.00 pts |
| Five years, annualized | 9.55% | 10.93% | (1.38) pts |
The investor perspective stands out. SCHD has outperformed its category significantly this year, but remains behind over a five-year period. As a result, the recent rally appears to reflect a value-and-income shift rather than evidence of lasting dominance.
Comparable data from peers shows a similar trend. SCHD posted a 23.81% return through July, outpacing the Vanguard High Dividend Yield ETF NYSEARCA:VYM at 14.21% and the Vanguard Dividend Appreciation ETF NYSEARCA:VIG at 10.12%. However, over ten years, VIG delivered a 13.04% annualized return, slightly higher than SCHD’s 12.66%.
| Largest position | Google Finance ticker | Portfolio allocation |
|---|---|---|
| Abbott Laboratories | NYSE:ABT | 4.77% |
| Amgen | NASDAQ:AMGN | 4.59% |
| Merck | NYSE:MRK | 4.43% |
| Coca-Cola | NYSE:KO | 4.16% |
| Home Depot | NYSE:HD | 4.05% |
| UnitedHealth | NYSE:UNH | 3.98% |
The ten largest holdings represent 41.45% of total assets, leaving the fund’s performance highly exposed to moves in major healthcare, consumer, and energy stocks, even though it holds 103 different securities.
| Analyst recommendation source | Rating | Target | Implied move from $34.35 | Method |
|---|---|---|---|---|
| MarketBeat | Moderate Buy | $34.03 | (0.9%) | 606 ratings over 25 holdings |
| TipRanks | Moderate Buy | $36.16 | 5.3% | 100 analysts covering holdings |
| ETF Research Center | Speculative / 92nd percentile | $35.05 | 2.0% | Sell-side consensus based on holdings |
The recommendation table highlights the increased significance of income following the rally. The three targets range from a minor loss to a 5.3% gain. Factoring in the 3.18% SEC yield boosts the potential total return, though it does not reinstate the margin of safety seen in January.
Transaction costs continue to be minimal. According to Schwab, the median bid-ask spread stood at three basis points, with 19.4 million shares changing hands as of Monday’s report. On Friday, the fund traded at a four-basis-point premium compared with its net asset value.
Risks: SCHD could face headwinds from dividend reductions, a shift away from value stocks, or a resurgence of growth stocks. Targets based on holdings may overlook shocks specific to individual companies and should not be seen as direct ETF predictions.
During the remainder of Monday’s trading, investors will monitor if SCHD maintains its $34.25 intraday low. The main challenge is yield support, as the fund—now trading close to its 52-week high—relies increasingly on cash payouts and earnings performance rather than multiple expansion.
Related articles: ETFs