
NEW YORK, August 9, 2026, 16:13 (EDT)
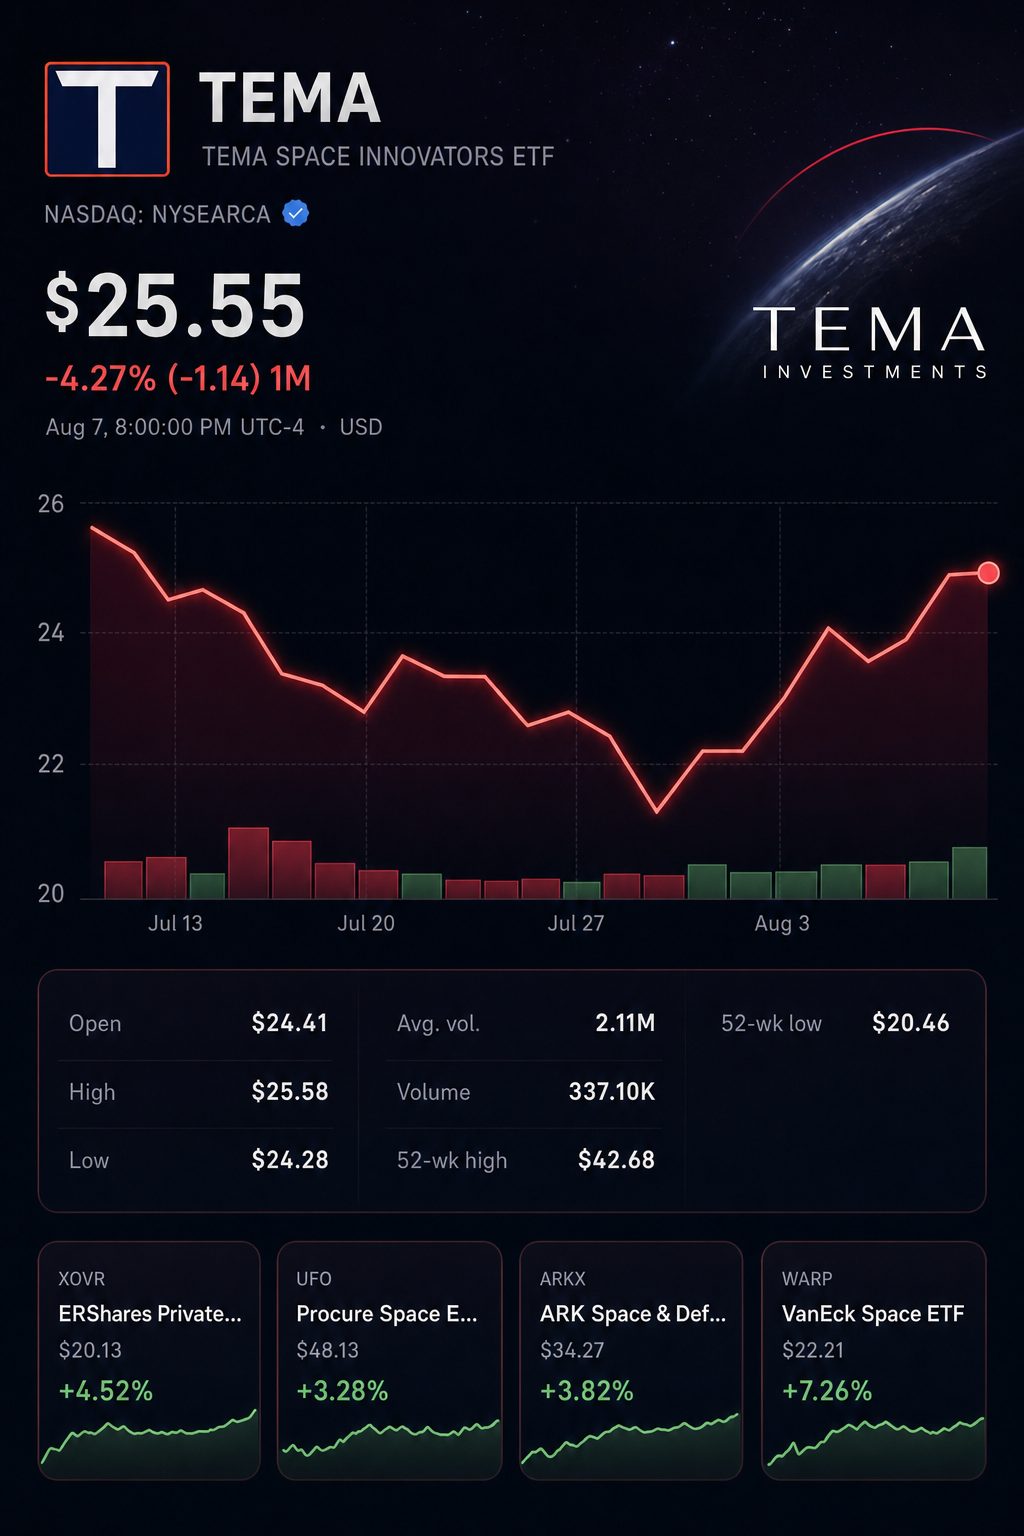
- The ETF ended trading on Friday at $25.55, marking an 18.2% gain for the week.
- Space Exploration Technologies Corp. NASDAQ:SPCX made up 18.85% of NAV. Based on an initial estimate, just around 3.6% consisted of public stock marked to market each day.
- Rocket Lab USA Inc. NASDAQ:RKLB and AST SpaceMobile Inc. NASDAQ:ASTS, together accounting for 17.07%, are scheduled to report after Monday’s market close.
The Tema Space Innovators ETF rose 18.2% over the past week, outperforming the strongest of three chosen space-fund competitors by 6.2 percentage points.
However, Monday’s earnings could prove more significant than SpaceX’s rally on Friday. Rocket Lab and ASTS together represent the second-largest risk allocation in the fund. Any changes in their share prices will feed immediately into the daily NAV.
U.S. cash markets did not open Sunday. NASA closed Friday at $25.55, rising 5.84%. NAV increased 5.49% to $25.49, resulting in a 0.22% premium.
Comparison with previous week’s closing price
| Fund | July 31 close | August 7 close | Weekly move |
|---|---|---|---|
| Tema Space Innovators ETF NYSEARCA:NASA | $21.62 | $25.55 | +18.2% |
| ARK Space & Defense Innovation ETF (BATS:ARKX) | $30.60 | $34.27 | +12.0% |
| Procure Space ETF (NASDAQ:UFO) | $43.79 | $48.13 | +9.9% |
| SPDR S&P Kensho Final Frontiers ETF (NYSEARCA:ROKT) | $110.17 | $120.01 | +8.9% |
Returns based on closing prices, not accounting for distributions.
NASA outperformed the Nasdaq Composite by roughly 13 points. The index rose 5.2% over the week. While a broad risk-on mood contributed, the choice of holdings played a larger role.
SpaceX represented the largest disclosed holding in the fund, accounting for 18.85% of NAV. This figure reflects two separate exposures governed by distinct valuation methodologies.
Tema reported a valuation of $179.7 million for its SpaceX special-purpose vehicle on Friday. The asset is held at transaction cost unless the fund sells. This stake represented roughly 15.25% of overall assets.
After subtracting that figure, approximately 3.60% remains in publicly listed SpaceX shares. This figure is a preliminary estimate. As a result, the majority of SpaceX exposure was not adjusted for Friday’s increase in the stock price.
Friday’s rebound extended beyond SpaceX. Using a basic closing-weight calculation, Rocket Lab accounted for nearly double SpaceX’s public impact.
Initial assessment of factors influencing Friday’s NAV
| Public holding | Friday NASA weight | Stock move | Approximate NAV effect |
|---|---|---|---|
| Listed SpaceX portion NASDAQ:SPCX | ~3.60% | +15.83% | +0.57 points |
| Rocket Lab USA NASDAQ:RKLB | 11.45% | +9.46% | +1.08 points |
| AST SpaceMobile NASDAQ:ASTS | 5.62% | +6.80% | +0.38 points |
| Firefly Aerospace Inc. NASDAQ:FLY | 4.36% | +11.01% | +0.48 points |
| Viasat Inc. NASDAQ:VSAT | 5.84% | -1.96% | -0.11 points |
Based on closing weights from August 7. These figures do not represent an official performance attribution.
These five holdings account for approximately 2.4 percentage points of NASA’s 5.49% NAV increase. The calculation does not include intraday transactions, cash, flows or other positions.
Shares in SpaceX climbed 15.83% on Friday. Earlier this week, Chief Financial Officer Bret Johnsen stated that investments in new compute capital were yielding “a less than one-year payback.” Despite this, quarterly capital expenditures totaled $18.4 billion. Reuters
On Monday, focus moves to the public book. Firefly is set to report on Tuesday. Collectively, these three planned events represent 21.43% of fund assets.
Reporting schedule for the upcoming week
| Date and time | Holding | NASA weight | Scheduled event |
|---|---|---|---|
| Monday, August 10, 17:00 EDT | Rocket Lab | 11.45% | Q2 results and conference call |
| Monday, August 10, 17:00 EDT | AST SpaceMobile | 5.62% | Business and financial report |
| Tuesday, August 11, 17:00 EDT | Firefly Aerospace | 4.36% | Q2 results and conference call |
Rocket Lab projects revenue in the $225 million to $240 million range. The company anticipates an adjusted EBITDA loss ranging from $20 million to $26 million. These projections mark the most specific near-term targets.
Most major public holdings continue to receive a positive analyst outlook. Analyst coverage for Firefly is less extensive and opinions on ASTS are more mixed.
Key holdings: Analyst ratings
| Holding | Buy | Hold | Sell | Average target | Implied upside |
|---|---|---|---|---|---|
| SpaceX | 24 | 6 | 2 | $226.14 | 69.9% |
| Rocket Lab | 13 | 4 | 0 | $110.53 | 33.4% |
| AST SpaceMobile | 4 | 5 | 1 | $88.87 | 23.5% |
| Firefly Aerospace | 3 | 2 | 0 | $44.40 | 66.2% |
| Viasat | 7 | 1 | 0 | $97.43 | 21.2% |
Shown is a snapshot for the past three months, as of Friday. These represent company recommendations, not ETF ratings.
NASA launched trading on March 31, closing Friday with 38 positions. Assets amounted to $1.18 billion and the expense ratio stood at 0.75%. The top 10 holdings made up 64.85% of NAV.
SpaceX now represents 18.85% of the portfolio, up from 10.03% at launch. This reflects an 87.9% rise in allocation, not in investment performance.
Risks: NASA remains highly concentrated and has operated for under five months. Its SPV presents liquidity and stale-pricing risks. Public assets are exposed to launch setbacks, dilution, postponed contracts and earnings shortfalls. Ongoing SpaceX lockup expiries through December may sustain elevated volatility.
Related articles: NASDAQ:ASTS
Further analysis
**What fueled NASA’s strong recovery on Friday?**
NASA finished the session at $25.55 on August 7, up 5.84%. SPY advanced 0.59%. SpaceX jumped 15.9%, and Rocket Lab was up 9.5%. Based on closing weights as an estimate, those changes account for roughly 4.1 points. SpaceX posted 92% revenue growth, though its capital expenditures in the quarter totaled $18.4 billion. ([SEC][1])
**What level of single-name risk does NASA have?**
SpaceX made up 18.85% of NAV, while Rocket Lab comprised 11.45%. The fund’s top ten holdings made up a combined 64.85% of total assets. Despite holding 38 positions, NASA is considered non-diversified by the SEC, making it possible for a small number of companies to drive returns. ([Tema ETFs][2])
**Did Friday’s recovery offset the previous downturn?**
No. NASA is still 40.1% under its $42.68 high. The most recent close, at $25.55, stands 24.9% higher than its $20.46 low. Both the high and low followed the fund’s March 30 debut. The prospectus cautions that investors should anticipate elevated volatility and potential large losses. ([Google][3])
**Is the early asset surge sustained?**
Assets dropped to $1.179 billion as of August 7, down from $2.9 billion on June 11, marking a 59.4% decrease in under two months. These numbers combine both market losses and redemptions, leaving the exact net outflows unclear. The fund's assets remain above $1 billion. ([Tema ETFs][2])
**Is NASA’s valuation made more complex by the SpaceX SPV?**
Tema discloses $179.7 million in SpaceX share equivalents held through an SPV. The SPV prices assets based on the most recent transaction, rather than live intraday quotes, which may reduce valuation precision during significant market shifts. Friday’s divergence was minor, with NASA settling 0.22% over NAV. The fund’s 30-day median bid-ask spread was 0.09%. The SEC continues to highlight concerns regarding valuation and resale risks. ([Tema ETFs][2])
[1]: https://www.sec.gov/Archives/edgar/data/1181412/000162828026052515/earningsreleaseq22608042.htm "www.sec.gov"
[2]: https://temaetfs.com/nasa "Tema's Space Innovators ETF (NASA) | Invest in the space economy"
[3]: https://www.google.com/finance/quote/NASA%3ANYSEARCA?utm_source=chatgpt.com "Tema Space Innovators ETF (NASA) Price & News"