
SAN FRANCISCO, August 20, 2026, 05:50 PDT — U.S. stocks were set to begin trading in 40 minutes.
- Piper Sandler’s $22 price target suggests an upside of about 20% from the August 18 reference price.
- In the second quarter, 51% of new products at SoFi were opened by current members.
- Among 27 analysts, Wall Street sentiment is cautious, with 13 assigning Hold ratings and five giving a Sell.
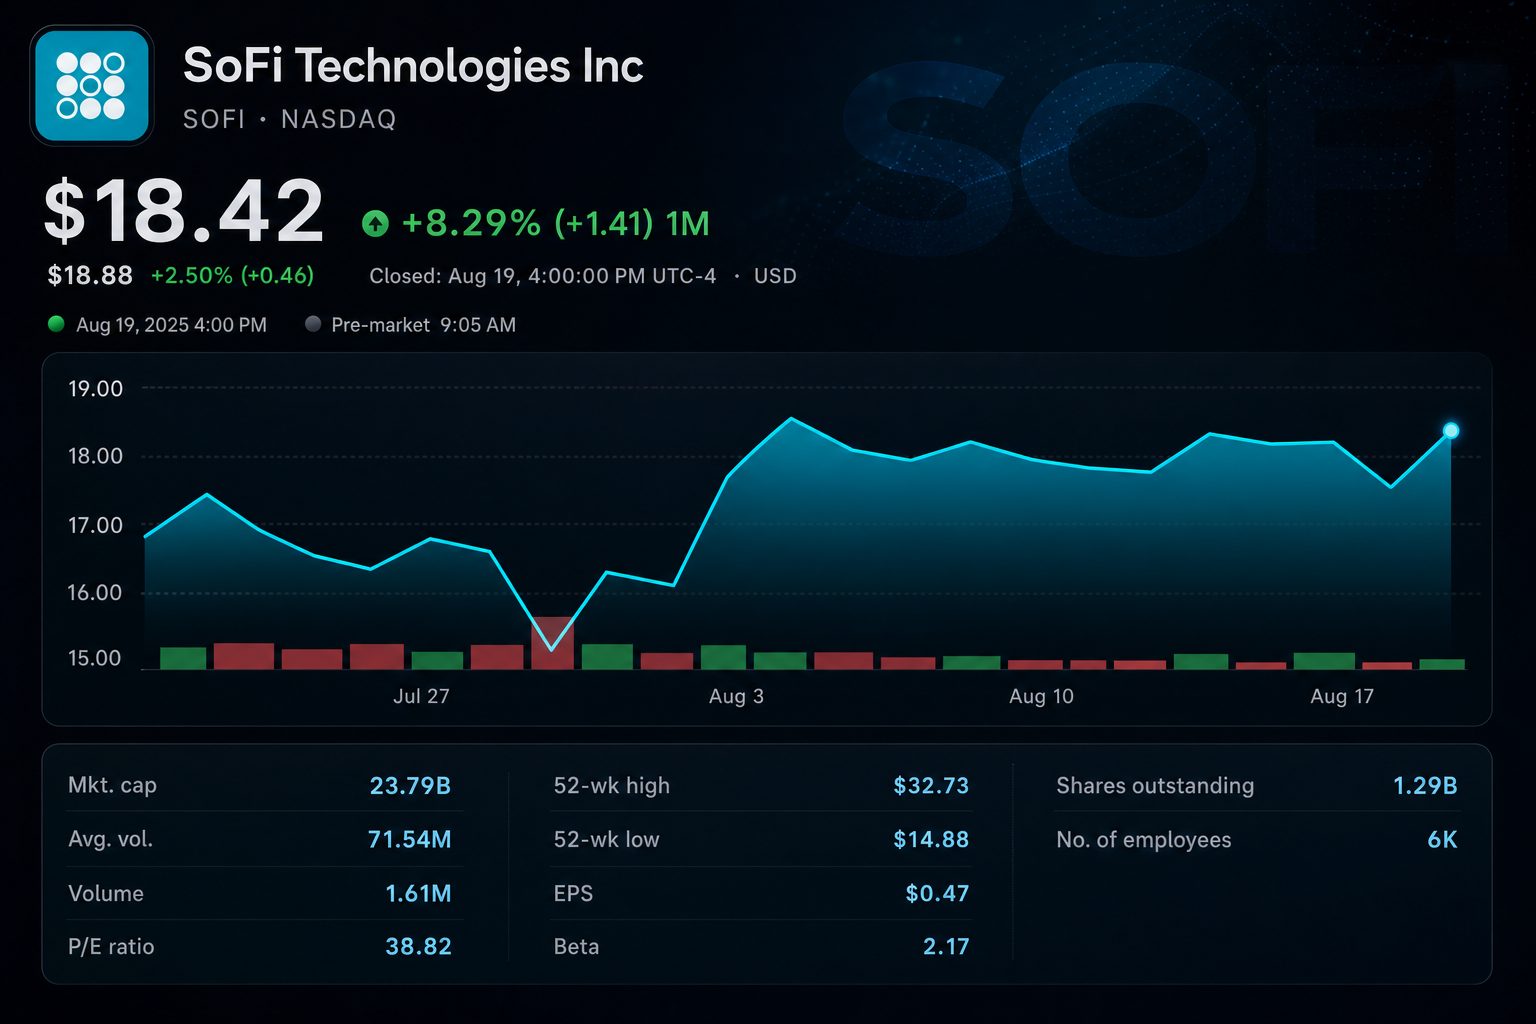
A new bullish outlook for SoFi Technologies NASDAQ:SOFI centers on increasing product adoption per customer rather than just loan expansion. Piper Sandler analyst Patrick Moley this week assigned a $22 price target, roughly 20% higher than the current reference price.
The important figure is 51%. That represents the proportion of second-quarter product openings by current members, up from 43% in the previous quarter and 35% in the comparable period last year.
This is significant since cross-selling allows marketing expenses to be allocated over a larger revenue base. In the quarter, SoFi reported an increase of 2.2 million products while gaining 1.1 million new members. The average number of products per member hit a new high of 1.54.
| Q2 2026 scorecard | Result | Year-on-year |
|---|---|---|
| Adjusted net revenue | $1.206 billion | up 40% |
| Adjusted EBITDA | $357.8 million | up 44% |
| Members | 15.8 million | up 35% |
| Products | 24.4 million | up 42% |
| Loan originations | $14.8 billion | up 69% |
Operating gains were widespread. Adjusted revenue increased by 40%, and adjusted EBITDA climbed 44%. This resulted in an adjusted EBITDA margin of 30%. GAAP net income totaled $156.6 million, or $0.12 per diluted share.
| Relationship metric | Q2 2026 | Comparison |
|---|---|---|
| New products by current members | 51% | 43% in Q1; 35% for Q2 2025 |
| Products per member | 1.54 | All-time high |
| Fee income | $472.3 million | 39% of overall revenue |
| Average deposits versus liabilities | Above 90% | Deposit yield 156 bp lower than warehouse funds |
| Savings from funding costs, annualized | $712.6 million | Company’s estimate |
Deposits played a significant role, providing funding for over 90% of average liabilities. SoFi reported that the average rate on these deposits was 156 basis points lower than the rate on warehouse facilities. This difference equated to approximately $712.6 million in annualized interest savings.
Chief Executive Anthony Noto described the quarter as “a clear inflection point.” Noto said members showed continued resilience, with strong spending, demand, and credit performance. Yahoo Finance
| Business line | Q2 2026 revenue | Year-on-year | Investor read-through |
|---|---|---|---|
| Lending, adjusted | $711.7 million | +59% | Primary driver of growth |
| Financial Services | $466.3 million | +29% | Supports cross-selling |
| Technology Platform | $84.5 million | -23% | Weighed down by client departures |
The mix remains unbalanced. Technology Platform revenue dropped 23% following the departure of a major client. Financial Services contribution margin declined to 46% from 52%. Continued investment is still needed for growth.
This helps clarify why analysts remain divided. SoFi lifted its 2026 revenue forecast to between $4.75 billion and $4.85 billion. However, the company maintained its adjusted EBITDA projection at close to $1.6 billion and kept its adjusted EPS unchanged at around $0.60. The move signaled to investors that profit gains in the near term may be modest.
| Analyst opinion | Suggestion | Price target / range | Date |
|---|---|---|---|
| Piper Sandler — Patrick Moley | Positive outlook | $22 | August 18, 2026 |
| Barron’s survey, 27 analysts | 9 Buy / 13 Hold / 5 Sell | Not disclosed | August 18, 2026 |
| S&P Global survey, 23 analysts | Hold | $19.92 average; $12–$30 span | August 12, 2026 |
| Morgan Stanley | Underweight | $16 | April 30, 2026 |
Moley’s situation thus relies on two factors. Cross-buy has to continue increasing, and that growth in engagement must also boost margins. The 51% cross-sell rate demonstrates the platform’s ability to strengthen customer ties. However, it remains unproven that each additional dollar will make it to earnings.
The next measure is operating leverage. Fee-based income accounted for 39% of overall revenue, and less expensive deposits reduced funding expenses. These improvements may balance out increased marketing spend and underperformance in the technology division.
Risks: Increased bond yields may weigh on fintech valuations and refinancing activity. Credit losses may increase if consumer strength declines. A sluggish recovery in the Technology Platform segment would leave SoFi reliant on its lending operations.
According to Barron’s, SoFi shares had risen 18% ahead of Moley’s call. The stock now requires results rather than fresh messaging. The $22 scenario is dependent on turning product breadth into sustained earnings.
Related articles: NASDAQ:SOFI

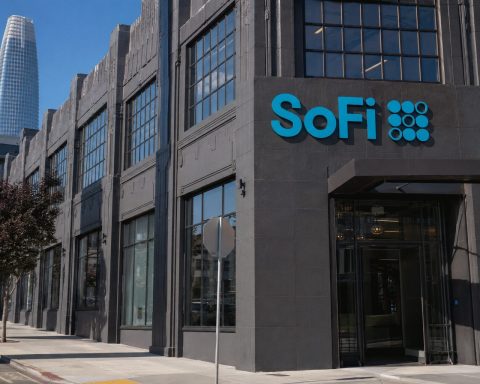

The $22 case runs through cross-sell
Growth engine: products are outrunning members
Member economics
2.2M products
What supports the premium
Revenue mix: strength with one visible drag
| Segment | Q2 revenue | YoY | Signal |
|---|---|---|---|
| Lending, adjusted | $711.7M | +59% | Strong |
| Financial Services | $466.3M | +29% | Strong |
| Technology Platform | $84.5M | -23% | Drag |
Wall Street target map
Street split
The bull case works if 51% cross-buy turns customer acquisition into repeat revenue, while cheap deposits protect margins. The bear case is simple: higher marketing, weaker technology revenue and tighter credit absorb the benefit.