
DENVER, August 24, 2026, 03:07 MDT —
- Spot gold climbed to $4,643.63, marking its highest point in over three months.
- For every $100 change in gold prices, Newmont’s annual revenue shifts by roughly $526 million based on its projected production levels.
- Newmont gained 11.7% over the past week, now coming within 0.7% of the consensus analyst target.
Newmont Corporation NYSE:NEM rose 0.6% to $132.35 in premarket trading on Monday as gold reached a three-month peak. The world’s largest publicly traded gold miner currently holds about $526 million in annual revenue leverage to each $100 shift in gold prices, according to its 2026 output outlook.
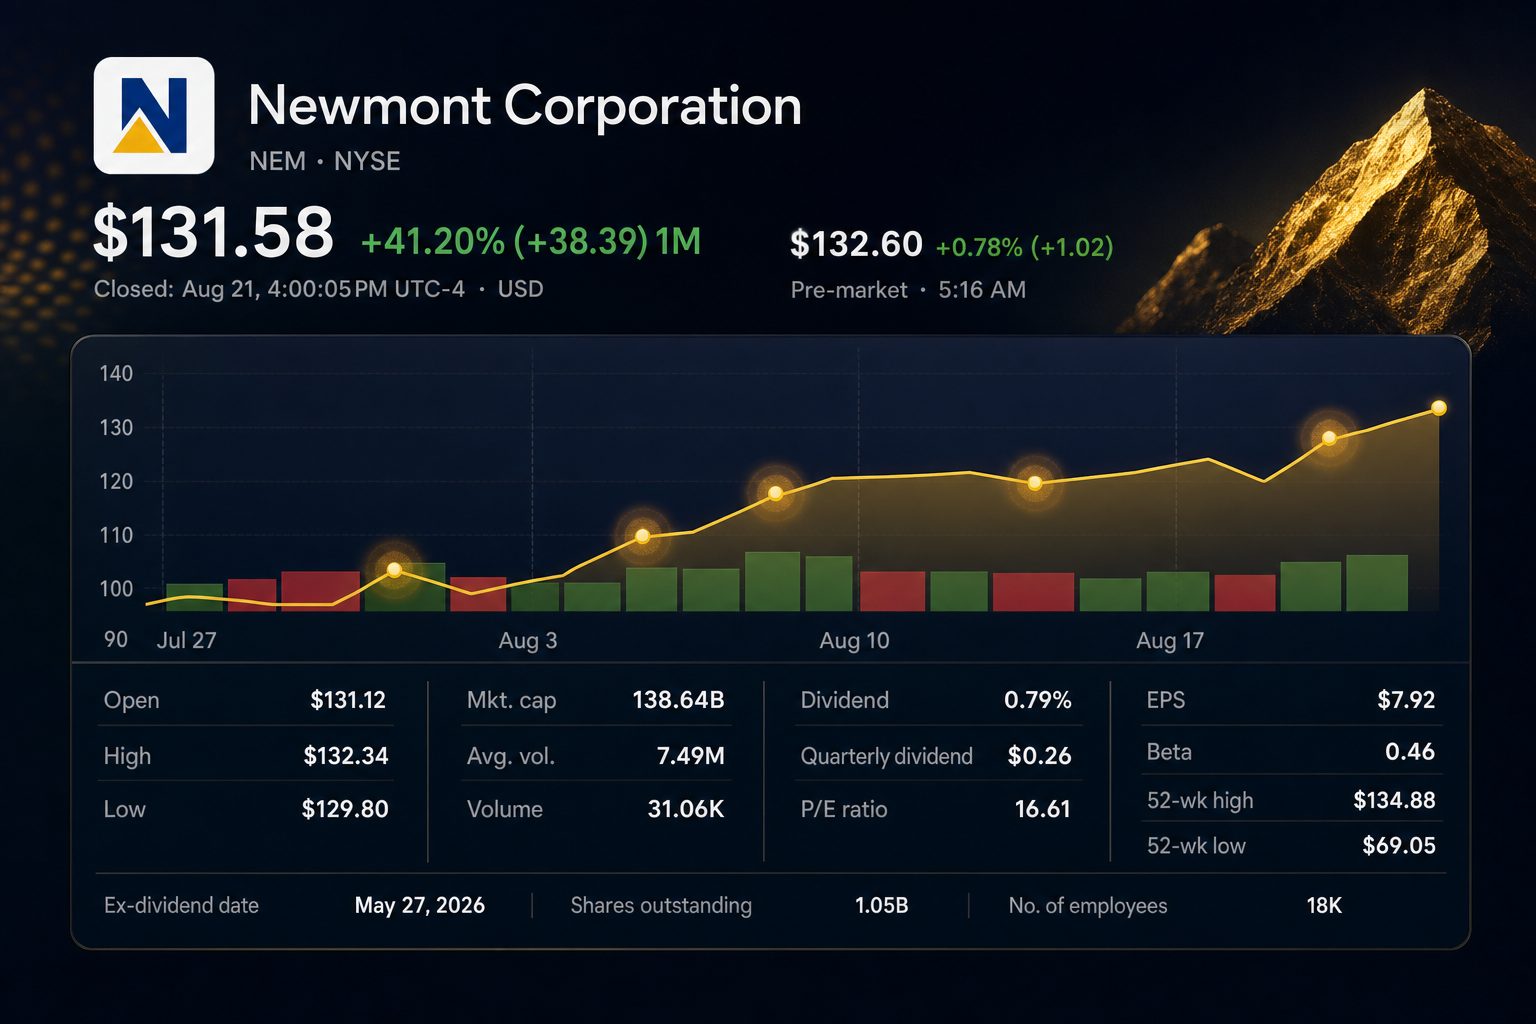
The advantage of that leverage is significant. Much of it is already reflected in the share price. Newmont rose 11.7% over the past week, closing Friday just 0.7% under the average analyst target of $132.44.
The estimate is based on an annual output guidance of 5.26 million attributable ounces. On Monday, the spot price stood $143.63 higher than Newmont’s $4,500 planning benchmark. If volumes remain unchanged, this difference equates to approximately $755 million in yearly revenue before accounting for royalties, taxes, and timing effects.
| Gold-price scenario | Price per ounce | Change vs. planning case | Estimated annual revenue effect |
|---|---|---|---|
| $100 less | $4,400 | -$100 | -$526 million |
| Newmont planning assumption | $4,500 | — | Baseline |
| Monday spot, 06:44 GMT | $4,643.63 | +$143.63 | +$755 million |
| $100 above Monday spot | $4,743.63 | +$243.63 | +$1.28 billion |
Spot gold climbed 0.9% to $4,643.63 as of 06:44 GMT, having advanced over 5% in the previous week. A softer dollar and uncertainty related to U.S. bond buybacks boosted demand. Investors are focused on Friday’s inflation figures and remarks from Federal Reserve Chair Kevin Warsh as the upcoming key events.
KCM Trade chief market analyst Tim Waterer said, “Gold is looking sprightly to start the week.” The metal hovered above key moving averages, having surpassed the 200-day line in the previous week.
Newmont further accelerated its gains. The stock advanced in four out of five sessions last week, with a 7.9% surge on Wednesday accounting for the bulk of the increase. On Friday, shares climbed another 3.1%, bringing the price close to the annual peak of $134.88.
| Date | Close | Daily move | Volume |
|---|---|---|---|
| August 14 | $117.76 | up 3.13% | 5.55 million |
| August 17 | $120.33 | up 2.18% | 7.18 million |
| August 18 | $115.98 | down 3.62% | 6.53 million |
| August 19 | $125.08 | up 7.85% | 9.02 million |
| August 20 | $127.64 | up 2.05% | 9.46 million |
| August 21 | $131.58 | up 3.09% | 10.45 million |
U.S. stocks were trading actively before the market opened at the time of publication. Newmont shares were quoted at $132.35 as of 04:41 EDT, representing a 1.9% decline from the 52-week peak. This price gave Newmont an approximate market value of $138.3 billion.
The operating spread is still considerable. On Monday, the spot price is 2.76 times higher than Newmont’s all-in sustaining cost guidance of $1,680. The resulting implied spread of $2,963.63 stands 6.1% greater than the spread seen in the second quarter, though actual prices and costs may vary.
| Operating measure | Q2 2026 actual | 2026 guidance | Monday market reference |
|---|---|---|---|
| Gold price | $4,414 realized | $4,500 assumption | $4,643.63 spot |
| AISC per ounce | $1,621 | $1,680 | $1,680 guidance proxy |
| Price less AISC | $2,793 | $2,820 | $2,963.63 estimated |
| Gold output | 1.29 million ounces | 5.26 million ounces | Guidance maintained |
Chief Executive Natascha Viljoen stated in July that Newmont delivered “record second quarter free cash flow of $2.2 billion.” Since its last earnings report, the company has distributed $1.9 billion via dividends and share repurchases. Newmont results
The repurchase boosts each share’s exposure to gold. Newmont has cut its number of shares by over 100 million since February 2024. As of its July filing, $4.3 billion of the authorized program was still available.
| Analyst measure | Count or rating | Price target | Implied move from Friday |
|---|---|---|---|
| Strong Buy | 15 | — | — |
| Buy | 5 | — | — |
| Hold | 2 | — | — |
| Strong Sell | 1 | — | — |
| Consensus, 23 analysts | Buy | $132.44 average | +0.65% |
| Scotiabank, August 12 | Buy | $149 | +13.2% |
| Barclays, July 28 | Buy | $124 | -5.8% |
Analysts remain largely optimistic, with 20 out of 23 ratings at Buy or Strong Buy. However, the average price target is now nearly reached, standing just nine cents higher than the most recent premarket price.
Risks: Leverage can also amplify losses. A $100 drop in gold price would reduce annual revenue by roughly $526 million before offsets. The spread would shrink with a stronger dollar, a hawkish Federal Reserve tone, or if costs exceed $1,680 per ounce.
The immediate focus is clear: gold needs to stay above Newmont’s $4,500 planning price as the shares approach $134.88. Should bullion fall beneath this level, a squeeze in analyst targets could outweigh the effects of operating leverage.
Related articles: NYSE:NEM