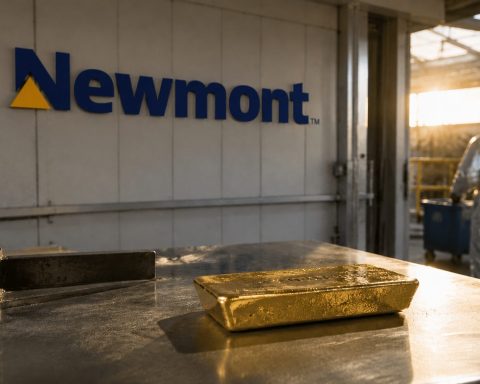

DENVER, August 24, 2026, 15:13 EDT — U.S. equities changed hands during the main trading session.
- Spot gold gained 0.8% to $4,639.49 per ounce, after reaching $4,680.70, its strongest since May 14.
- U.S. gold futures for December closed up 0.4% at $4,697.80.
- SPDR Gold Shares rose 0.41%, while Newmont fell 0.40% as increased costs curbed the miner’s exposure to bullion.
- Investors put $6.4 billion, equivalent to 46.7 tonnes, into gold-backed funds last week, marking the highest weekly inflow in 10 months.
Gold climbed to its highest level in three months on Monday, supported by a softer dollar and renewed Treasury buybacks. The gains lifted bullion above a significant technical level ahead of U.S. inflation figures.
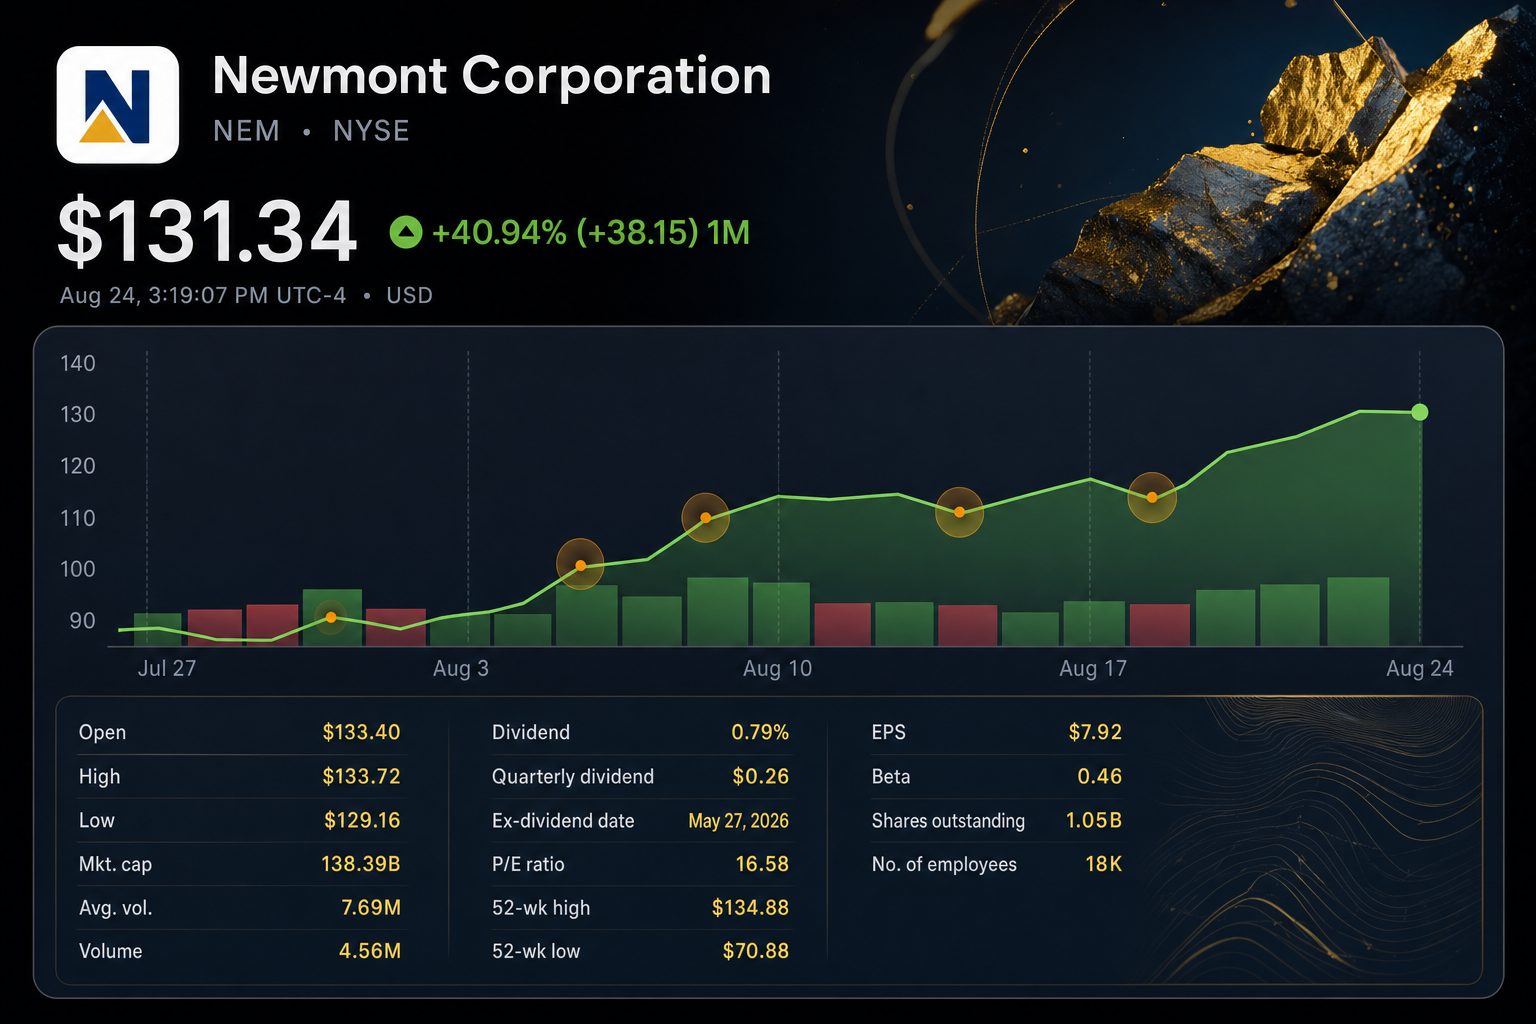
The reaction in equities was more muted. Shares of Newmont Corporation NYSE:NEM slipped 0.40% to $131.04 at 14:46 EDT, after earlier touching $133.64. The pullback suggests investors are balancing expectations for mine expenses and recent strong performance with the gains in metal prices.
| Gold-market measure | Latest level | Move | Timestamp |
|---|---|---|---|
| Spot gold | $4,639.49/oz | up 0.8% | Aug. 24, 14:25 EDT |
| Spot intraday high | $4,680.70/oz | Strongest level since May 14 | Aug. 24 |
| December gold futures | $4,697.80/oz | advanced 0.4%, closed | Aug. 24 |
| SPDR Gold Shares NYSEARCA:GLD | $425.09 | rising 0.41% | Aug. 24, 14:56 EDT |
Last week, gold gained over 5%. The U.S. Treasury’s buyback initiative sent the dollar to its lowest levels in several months, reducing the cost of gold for holders of other currencies. The metal also advanced beyond its 200-day moving average.
Jim Wyckoff, market analyst at American Gold Exchange, said “the fundamentals and technicals are kind of lining up bullish.” He noted that the metal was also buoyed by somewhat lower bond yields. Reuters
| Newmont tape | Value | Investor read |
|---|---|---|
| Share price | $131.04 | Down 0.40% as of Aug. 24 at 14:46 EDT |
| Day range | $129.17–$133.64 | Earlier gains tied to gold gave way |
| Market value | $139.8 billion | Major mining company |
| Price/earnings | 16.5 times | Reflects $7.92 trailing EPS |
| Average analyst target | $136.58 | 4.2% higher than current share price |
The gap between the operating spread is still significant. On Monday, the spot price exceeded Newmont’s second-quarter by-product all-in sustaining cost by $3,018. However, the cost metric surged by 58% compared to the first quarter, driven by higher sustaining capital and additional costs following seismic disruption at Cadia.
| Newmont operating measure | Q2 2026 | Context |
|---|---|---|
| Average realized gold price | $4,414/oz | $225 under Monday’s spot |
| By-product AISC | $1,621/oz | Quarterly increase of 58% |
| Attributable gold output | 1.29 million oz | Guidance at 5.3 million oz for the full year |
| Free cash flow | $2.2 billion | Highest Q2 on record |
| Repurchases since prior call | $1.7 billion | $4.3 billion in authorization left |
Newmont’s cash generation in the second quarter provides flexibility to manage operational fluctuations. Chief Executive Natascha Viljoen stated the company delivered production of approximately 1.3 million ounces and is maintaining its trajectory toward the 2026 guidance.
Analysts maintain an optimistic outlook, though their valuations differ widely. Out of 12 analysts monitored by Google Finance, 11 recommend buying the stock. Price targets vary between $110 and $170.
| Analyst | Firm | Rating | Target | Date |
|---|---|---|---|---|
| Lawson Winder | Bank of America Securities | Buy | $145 | Aug. 16, 2026 |
| Josh Wolfson | RBC Capital | Buy | $135 | Aug. 17, 2026 |
| Anita Soni | CIBC | Buy | $170 | Aug. 14, 2026 |
| Tanya Jakusconek | Scotiabank | Hold | $149 | Aug. 12, 2026 |
| Steven Green | TD Cowen | Buy | $133 | Aug. 12, 2026 |
Attention now turns to policy developments. The U.S. personal consumption expenditures price index is set for release on Wednesday. Federal Reserve Chair Kevin Warsh is expected to deliver remarks on Friday in Jackson Hole.
Rising inflation may boost gold’s appeal as a hedge, but it could also push real yields higher. A firmer dollar would pose a headwind for the rally. At Newmont, mine disruptions, royalties, and sustaining capital requirements may stop increased spot prices from converting to additional free cash flow.
Risks: Gold prices may fall sharply if the dollar strengthens or bond yields recover. Newmont is also exposed to production, cost, tax, and operational risks due to its wide-ranging geographic portfolio.
The main issue is straightforward. Bullion prices have climbed, yet Newmont needs to demonstrate that its operating margin can keep pace.
Related articles: NYSE:NEM