
NEW YORK, August 20, 2026, 14:50 EDT — U.S. cash equities are trading.
- Ambev saw 95.7 million ADRs change hands, marking the largest 2026 volume and surpassing its 10-day average by 3.3 times.
- The stock rose only 0.2% to $2.815, with substantial trading volume and little change in price.
- Today’s traded volume accounts for 34% of the 279 million treasury shares that were cancelled last week.
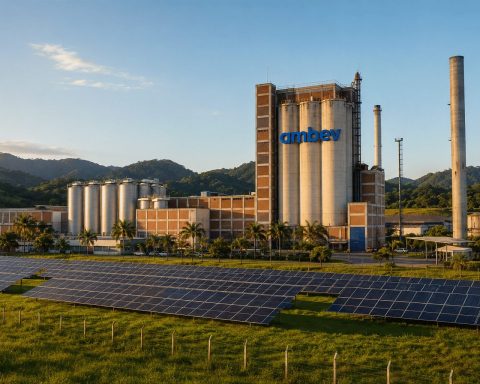
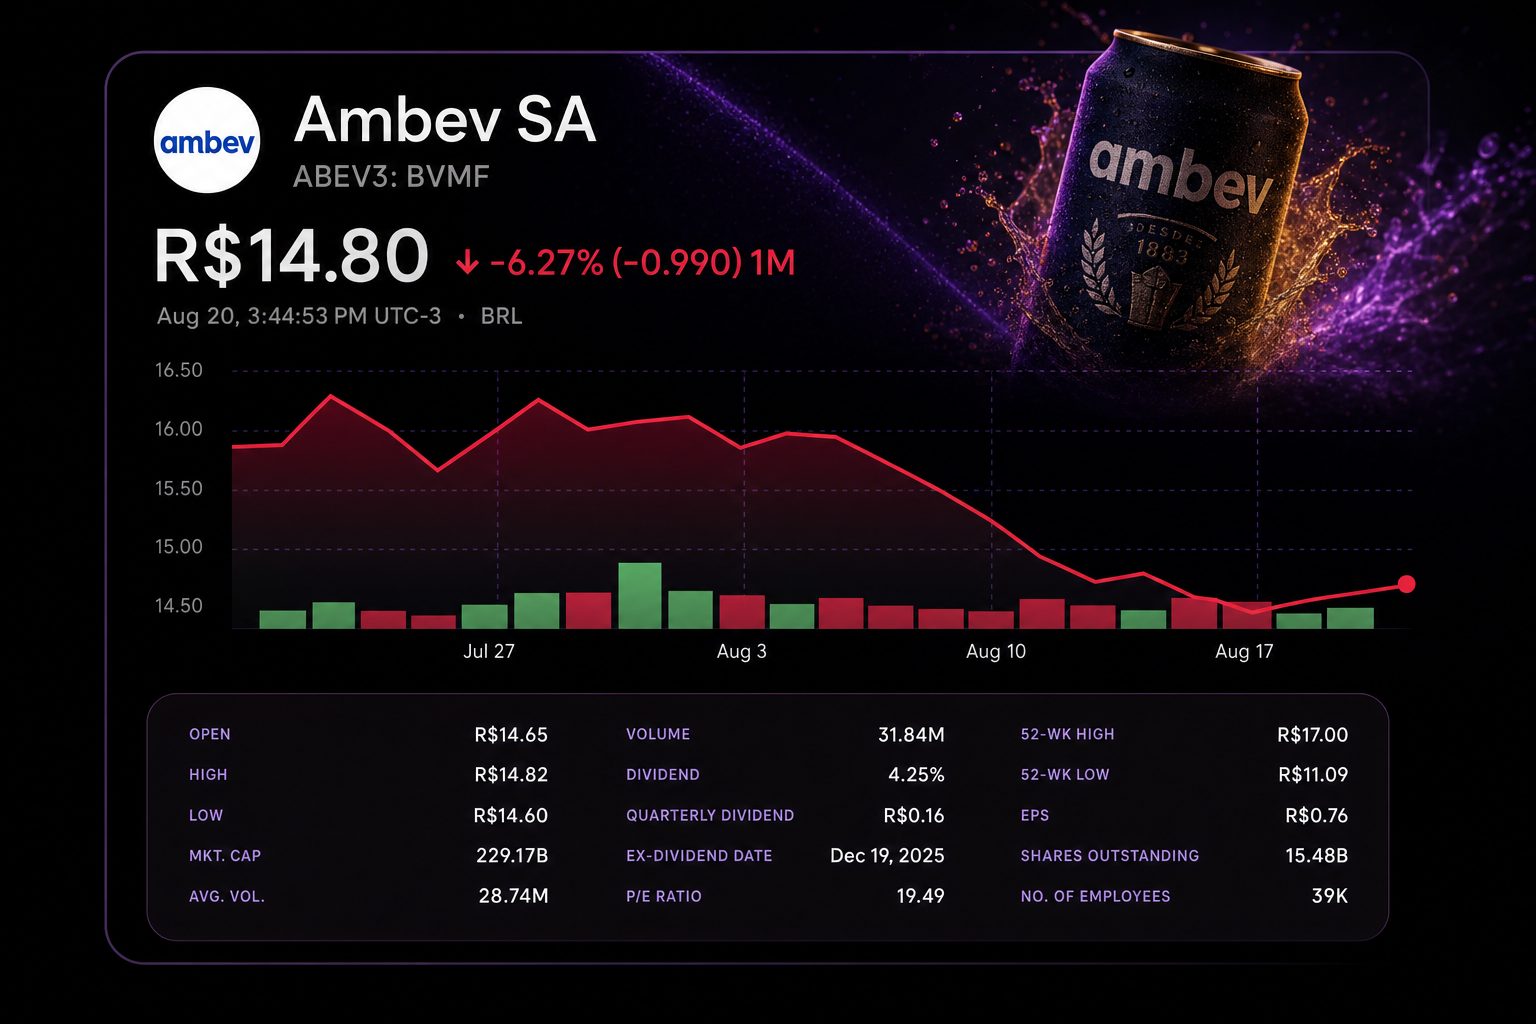
Ambev S.A. (NYSE:ABEV) saw 95.7 million American depositary receipts change hands as of 14:50 EDT, marking its busiest session of 2026. The stock inched up 0.2% to $2.815.
The difference is more significant than the placement. Turnover was 3.3 times above the 10-day average and exceeded the total of every full session this year by no less than 30%.
High trading volume with minimal movement in price indicates an equilibrium between buyers and sellers. There is no indication of who participated in the trades. As of early afternoon, there was no new company filing or confirmed corporate event to account for the surge.
| Volume comparison | ADRs | Today’s multiple |
|---|---|---|
| August 20, 14:50 EDT | 95.7 million | 1.00× |
| 10-day daily average | 29.0 million | 3.30× |
| Three-month daily average | 27.4 million | 3.50× |
| Previous 2026 peak, May 8 | 73.5 million | 1.30× |
| One-year maximum, Oct. 30, 2025 | 129.9 million | 0.74× |
Preliminary data showed the day’s turnover had a notional value close to $269 million, equaling nearly 0.62% of Ambev’s share count after the cancellation. The company’s market capitalization stayed around $43.4 billion.
Capital returns offer the most straightforward recent context. On August 13, Ambev cancelled 279 million treasury shares, lowering the capital base by approximately 1.8% to 15.485 billion shares while maintaining stated capital.
On Thursday, ADR volume was 34.3% of the canceled block. This is a scale comparison and not a causal link. Treasury shares that were canceled are ineligible for trading, and the identities of those trading today are not disclosed.
| Second-quarter measure | 2Q 2026 | Year-on-year change |
|---|---|---|
| Net revenue | R$20.15 billion | +6.1% organic |
| Normalized EBITDA | R$6.38 billion | +8.9% organic |
| Normalized EBITDA margin | 31.6% | up 80 basis points |
| Normalized profit | R$3.49 billion | increased 23.3% |
| Consolidated volume growth | — | organic rise of 1.4% |
Profit growth continues to be driven by margins. Normalized profit for the second quarter climbed 23.3%, with organic revenue up 6.1%. Beer volumes in Brazil expanded 5%.
Chief Executive Carlos Lisboa stated that the World Cup effect was over, but “our own game has only reached halftime.” Premium beer sales increased by close to 20%. Non-alcoholic beer sales were up roughly 20%. Ambev earnings-call transcript
Despite the increase in profits, analysts are still wary. Out of 11 analysts, the consensus rating is Hold and the mean price target is $3.33. This suggests an 18.3% potential gain from the current intraday price. However, ratings range from Buy to Sell.
| Date | Analyst / firm | Recommendation | Target | Vs. $2.815 |
|---|---|---|---|---|
| Aug. 11 | Rodrigo Alcantara / UBS | Sell | $2.85 | +1.2% |
| Aug. 3 | Nadine Sarwat / Bernstein | Hold | Not stated | — |
| July 28 | Benjamin Theurer / Barclays | Hold | $3.50 | +24.3% |
| Feb. 27 | Thiago Bortoluci / Goldman Sachs | Sell | $2.35 | -16.5% |
| Feb. 13 | Robert Ottenstein / Evercore ISI | Buy | $4.00 | +42.1% |
The flat performance leaves valuation debates unsettled. ABEV is priced at roughly 14 times its trailing earnings, standing 18.4% beneath its 52-week peak, but remaining 34% higher than its 52-week low.
Risks: Intraday volume figures are provisional and might reflect non-directional block trades. Movements in currency can affect the ADR. Margin improvements could be counteracted by weaker consumer demand, higher input costs, or reduced beer volumes.
The next key indicator will be the closing auction. If the price drops with even greater trading volume, it would point to strong conviction. However, if the market ends flat again, it may reflect positioning rather than an updated earnings outlook.
Related articles: NYSE:ABEV

Turnover surged. The stock barely moved.
Session volume
Turnover ratio
Market value
52-week range
Volume pressure test
Capital action
Second-quarter operating scorecard
| Measure | Result | Year on year |
|---|---|---|
| Net revenue | R$20.15B | +6.1% organic |
| Normalized EBITDA | R$6.38B | +8.9% organic |
| EBITDA margin | 31.6% | +80 bp |
| Normalized profit | R$3.49B | +23.3% |
| Consolidated volume | — | +1.4% organic |