
NEW YORK, August 3, 2026, 09:26 EDT — AMC Entertainment traded higher before the bell after a record-setting Spider-Man weekend drove another jump in its screen productivity.
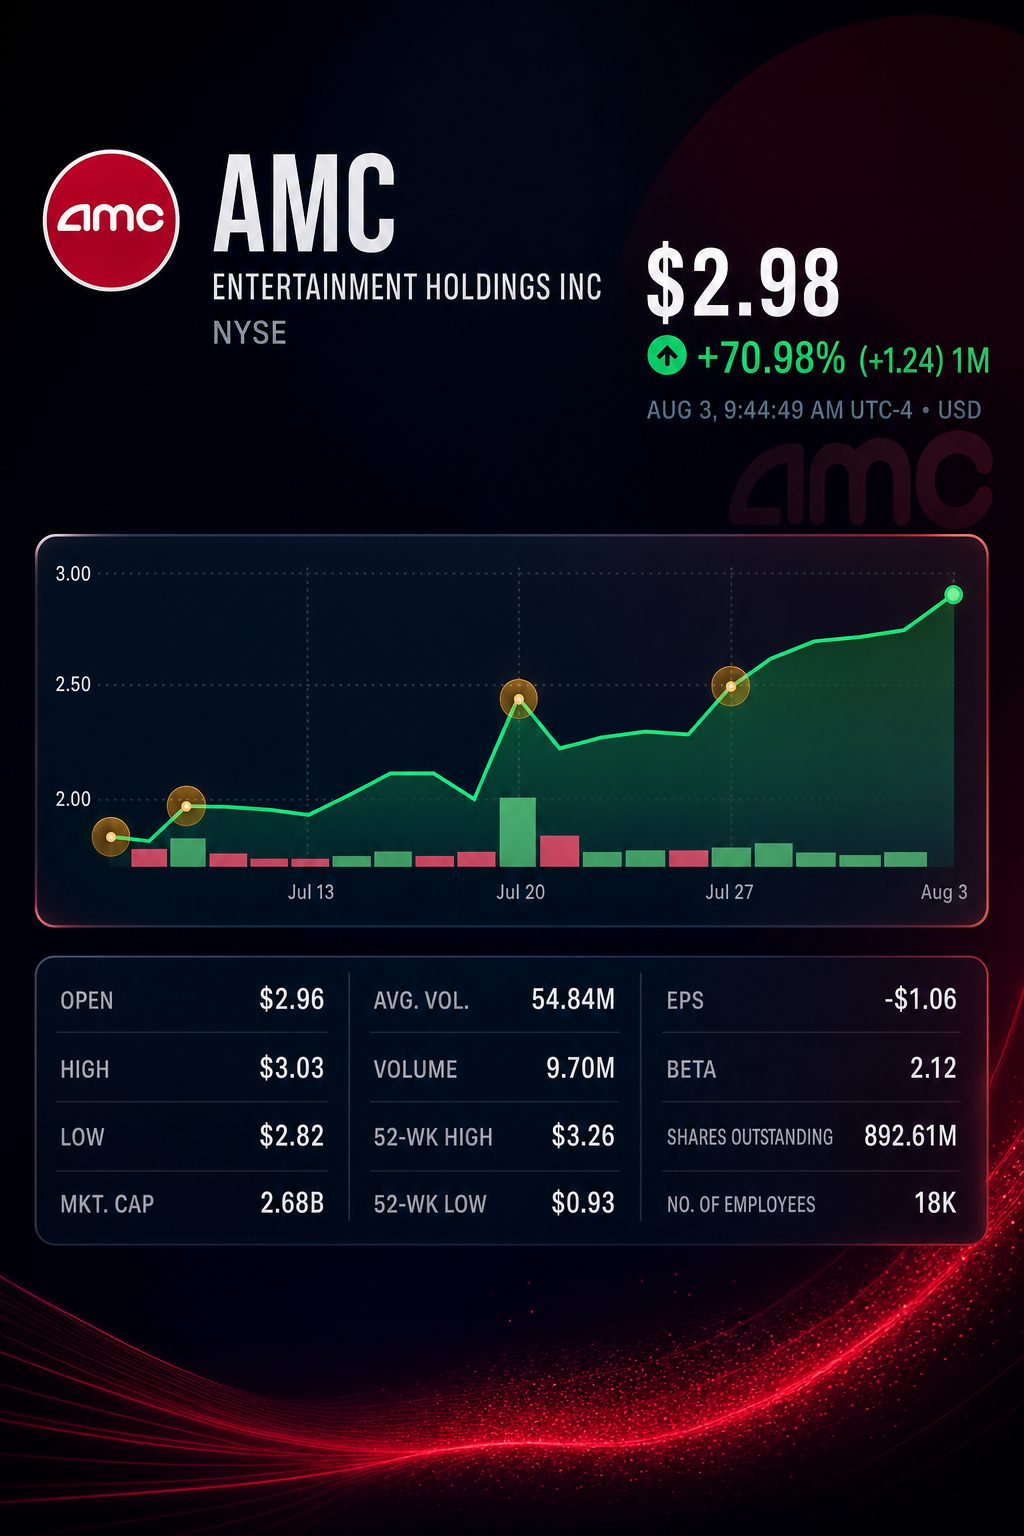
- In delayed premarket action, AMC shares were pointed up by 6.4% at $3.00.
- Over 10.2 million guests generated all-time highs in admissions, food-and-beverage sales, and total weekend revenue.
- Average screen attendance in Q2 climbed 15.4%. Adjusted EBITDA per screen jumped 72.4%, according to company filings.
AMC Entertainment Holdings, Inc. NYSE:AMC reported more than 10.2 million guests attended AMC and ODEON theaters between Wednesday and Sunday. The company achieved record highs for total revenue, admissions, and food-and-beverage sales for a weekend. The stock was up 6.4% at $3.00 in pre-market trading on Monday.
The investor focus has shifted to productivity per screen rather than growing theatre numbers. AMC’s average number of screens dropped 1.6% in the second quarter. However, attendance per screen rose by 15.4%. The most recent five-day total was at least 2.6 times greater than AMC’s five-day average during Q2.
The weekend delivered strong results, though most earnings were concentrated. Spider-Man: Brand New Day and The Odyssey accounted for nearly 94% of the record box office total in North America.
| Weekend leader | North American revenue | AMC premium-format note |
|---|---|---|
| Spider-Man: Brand New Day | $355 million | Highest-ever Dolby Cinema weekend attendance |
| The Odyssey | $51 million | High IMAX interest; 70mm screenings ran all day in New York |
| Total | $406 million | 94.4% share of about $430 million market overall |
The movies targeted separate premium formats. Spider-Man was showcased in Dolby Cinema, while The Odyssey maintained audience interest for IMAX. This lessened competition between premium formats within AMC’s network.
AMC has not revealed its weekend box office revenue. Using Q2’s per-patron revenue of $22.40, the attendance figures reported suggest an estimated total of around $228 million. This figure represents a provisional run-rate calculation, not an official company forecast. Actual results may vary based on the weekend’s ticket prices and movie lineup.
Strong fixed-cost leverage was already evident in Q2.
| AMC operating measure | Q2 2026 | Q2 2025 | Change |
|---|---|---|---|
| Attendance | 71.3 million | 62.8 million | +13.5% |
| Average screens | 9,249 | 9,402 | -1.6% |
| Attendance per average screen | 7,708 | 6,680 | +15.4% |
| Revenue per average screen | $172,600 | $148,700 | +16.1% |
| Adjusted EBITDA per average screen | $34,800 | $20,200 | +72.4% |
Revenue increased by 14.2%, as adjusted EBITDA climbed 69.6%. The adjusted EBITDA margin expanded by 6.6 percentage points to reach 20.1%. Average ticket prices edged down by 0.2%, leaving volume and concession sales as the key growth factors.
Cinemark Holdings, Inc. NYSE:CNK announced on Monday that it achieved its highest-ever domestic weekend results. The company broke records in ticket sales, premium format attendance, and food-and-beverage revenue, reinforcing that the rise was seen throughout the industry.
| Q2 2026 measure | AMC | Cinemark |
|---|---|---|
| Revenue | $1.597 billion | $1.086 billion |
| Attendance | 71.3 million | 63.7 million |
| Adjusted EBITDA | $321.4 million | $294.0 million |
| Adjusted EBITDA margin | 20.1% | 27.1% |
| Net income/(loss) | $(11.4) million | $139.4 million |
| Interest expense | $136.0 million | $31.3 million |
| Interest expense/adjusted EBITDA | 42.3% | 10.6% |
Non-GAAP metrics may vary. However, the difference remains significant. AMC posted roughly 47% higher revenue than Cinemark, yet its adjusted EBITDA was just 9% greater. Its interest expense for the quarter represented 42% of adjusted EBITDA, whereas for Cinemark, this ratio stood at 11%.
AMC strengthened its balance sheet in the first half, largely due to issuing new equity. The company’s cash position climbed 82% and principal debt declined 3%. The number of shares outstanding grew by 74%.
| AMC balance-sheet measure | June 30, 2026 | Dec. 31, 2025 | Change |
|---|---|---|---|
| Cash and equivalents | $778.4 million | $428.5 million | up 81.7% |
| Principal debt | $3.914 billion | $4.024 billion | down 2.7% |
| Principal debt less cash | $3.136 billion | $3.596 billion | fell 12.8% |
| Shares outstanding | 892.6 million | 512.9 million | increased 74.0% |
| Working-capital deficit | $(901.0) million | $(1.091) billion | narrowed by $189.6 million |
The net-debt figure does not include leases or restricted cash. Operating cash flow for the half year shifted to a positive $106.9 million, compared to an outflow of $231.6 million previously. Net proceeds from equity sales totaled $334.6 million. With shares trading at $3.00, AMC’s market capitalization stood at roughly $2.68 billion based on June’s share count. This fell short of the $3.14 billion net debt estimate.
CEO Adam Aron described the weekend as “a powerful and unmistakable reminder” of demand for cinemas. Cinemark also reported record numbers for ticket sales and premium formats, reinforcing that sentiment. AMC Entertainment Holdings, Inc.
Ross Benes, senior TV and streaming analyst at eMarketer, expressed caution following AMC’s second-quarter results. While strong performances sometimes repeat, he said, “the industry’s struggles will remain.” Reuters
Risks: Two movies accounted for about 94% of the market’s weekend box office. AMC reported $3.91 billion in outstanding principal debt and a $901 million shortfall in working capital. The company stated its historical rate of cash burn was unsustainable in the long run. It also indicated it may pursue additional share offerings.
The subsequent test concerns sustained demand. If the film maintains robust performance over another weekend, it could further enhance third-quarter results. However, this alone would not resolve the per-share balance sheet issue for AMC.
Related articles: NYSE:AMC