
Bitcoin ETF Inflows Resume, but Renewed Demand Centers on Single Fund
30 July 2026
2 mins read

Bitcoin ETF Inflows Resume, but Renewed Demand Centers on Single Fund

NEW YORK, July 30, 2026, 05:59 EDT

  • U.S. spot bitcoin ETFs saw inflows of $32.1 million on Wednesday, with IBIT accounting for $89.8 million of that total.
  • The rebound offset only 6.1% of the outflows from the previous four sessions.
  • The Federal Reserve opted to keep interest rates steady at 3.50%-3.75%, with the decision passing by a 9-3 split vote.

Spot bitcoin ETFs listed in the U.S. saw net inflows resume on Wednesday, with a $32.1 million total increase. However, this figure was boosted largely by BlackRock ’s iShares Bitcoin Trust, or IBIT, which attracted $89.8 million. Ahead of the U.S. cash ETF trading session, bitcoin traded at close to $64,488.
Fidelity’s FBTC saw outflows of $43.1 million, while ARK 21Shares’ ARKB posted a further $14.6 million in losses. Nine separate funds recorded zero net change. As a result, redemptions accounted for 64.3% of IBIT’s inflows.

Analysis from Farside Investors’ series indicates only modest improvement to date.

Flow periodSessionsNet flowShare of prior move
July 14-22 inflow sequence7+$999.3 million
July 23-24 reversal2-$465.2 millionStreak cut by 46.6%
July 27-28 continuation2-$61.3 millionFurther outflows observed
July 29 rebound1+$32.1 million6.1% of the previous four sessions’ decline

The most recent session made only a modest recovery from earlier losses. The prior four sessions saw declines totaling $526.5 million. Over the five sessions ending Wednesday, funds posted a cumulative loss of $494.4 million.

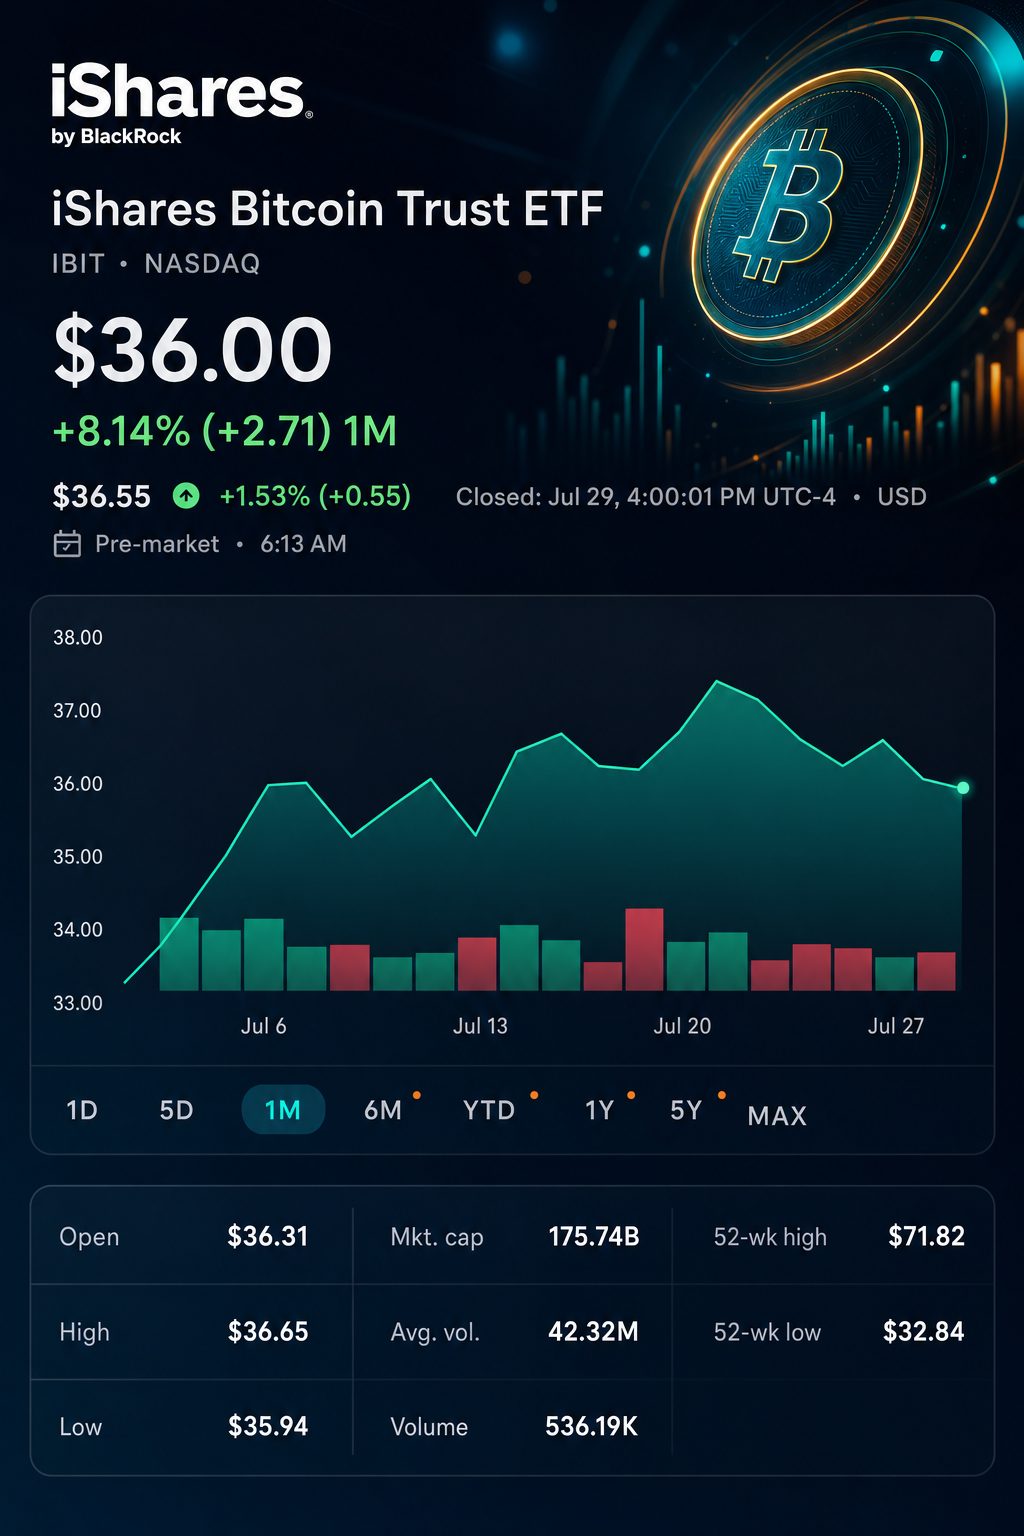
Stock chart for NASDAQ:IBIT

According to The Daily Upside, data from Morningstar Inc. showed the prior streak exceeded $1 billion. Bitwise Asset Management’s chief investment officer Matt Hougan stated: “The marginal buyer of a crypto ETF right now is probably a financial advisor.” The Daily Upside

That buyer has not emerged widely so far. Roxanna Islam, head of research at TMX VettaFi, stated that institutions continued to display “a lot of ambiguity.” The Daily Upside

The division at the fund level further challenges the straightforward low-fee argument. Farside reports the numbers in millions of dollars.

FundAnnual feeJuly 29 flowCumulative net flow
iShares Bitcoin Trust, IBIT0.25%+89.8+60,420
Fidelity Wise Origin Bitcoin Fund, FBTC0.25%-43.1+9,968
ARK 21Shares Bitcoin ETF, ARKB0.21%-14.6+1,318
Grayscale Bitcoin Mini Trust, BTC0.15%0.0+2,632
Grayscale Bitcoin Trust, GBTC1.50%0.0-27,416
All funds+32.1+51,410

IBIT received all total inflows even though there were a number of less expensive options available. This points to scale and liquidity outweighing fee considerations on Wednesday. However, it has not yet shown a permanent change in allocation.

IBIT’s total intake stands at $60.42 billion, accounting for 117.5% of the category’s combined flow. Without IBIT, the rest of the funds show a net outflow of $9.01 billion. A significant share of this shortfall comes from extended withdrawals from GBTC.

Macroeconomic conditions stay challenging. The Federal Reserve kept its target range steady at 3.50%-3.75%. Three members advocated for a 25 basis-point hike right away. Chair Kevin Warsh gave scant forward guidance, stating: “This Fed will not waver.” Federal Reserve

Bitcoin outperformed U.S. stocks following the decision. Reporting periods vary since cryptocurrency is traded around the clock.

MarketLatest reported moveReference point
Bitcoinup 0.9%$64,020 during Asia trade
S&P 500down 1.52%Wednesday closing level
Nasdaq Compositedown 1.74%Wednesday closing level
Dow Jones Industrial Averagedown 2.19%Wednesday closing level
U.S. dollar indexup 0.1%100.93 during Asia trade

That relative strength could support appetite for ETFs. However, increased long-term yields continue to make non-yielding assets more expensive to hold. The 30-year Treasury yield climbed to its highest point in nearly 20 years.

U.S. growth and inflation figures are next on the radar for investors. GDP and personal-spending data are due ahead of Thursday’s cash market opening. According to a Reuters poll, the initial median estimate for GDP growth stands at 2.1% annualized.

Upcoming catalystDate and time, EDTMarket impact
Q2 GDP initial readingJuly 30, 08:30Growth outlook and rate projections
June personal income, spending and PCE inflationJuly 30, 08:30Fed’s key inflation benchmark
June trade deficit and JOLTSAugust 4Indicators for demand and labour market trends
July jobs dataAugust 7, 08:30September policy rate consideration
Upcoming FOMC meetingSeptember 15-16Forthcoming policy announcement

Calendar dates are sourced from the BEA, BLS, and Federal Reserve.

Risks are balanced in both directions. If inflation eases, bitcoin and ETF inflows may see support. However, stronger economic data, increasing yields, or heightened geopolitical tensions could trigger renewed redemptions.

Investors will next look for broader participation. To confirm the rebound, positive flows need to extend beyond IBIT and persist through upcoming data releases. For now, gains remain focused rather than established.

TS2 TECH • EXTENDED COVERAGE

Further analysis

What is the current trading price of FBTC?

FBTC was up 1.57% in premarket trading at $56.16 as of 5:34 a.m. EDT on Thursday. The ETF ended Wednesday’s regular session at $55.29, down 0.45%. Bitcoin hovered around $64,488, within an intraday range of $63,252 to $64,640. Premarket share volume was 5,920. The opening print could show significant volatility. MarketWatch

What has FBTC’s recent performance been like?

As of Wednesday, FBTC had declined 27.47% so far in 2026. The fund dropped 46.06% over the past year and 15.86% in the previous three months. However, its most recent one-month performance was a gain of 5.27%. The closing price of $55.29 was 49.9% below the yearly peak of $110.25, but stood 9.5% higher than the $50.48 annual low. Morningstar

Does FBTC closely follow Bitcoin’s performance?

Fidelity listed a NAV of $55.591183 per share as of July 29. The closing price on Wednesday was 0.54% under that NAV. In premarket trading, the price was about 1.0% higher than the NAV, which remains unchanged since July 29. This comparison is not exact, since bitcoin trades around the clock but FBTC’s official NAV is updated only once a day. Over time, returns are expected to mirror Fidelity’s bitcoin reference rate, accounting for fees and other costs. Fidelity

What is the size and liquidity level of the Fidelity Bitcoin fund?

Fidelity recorded 197.9 million shares outstanding at Wednesday’s NAV, indicating approximately $11.0 billion in net assets. Trading volume on Wednesday was five million shares, while the average sits at 4.05 million. That accounted for an estimated $276 million worth of trades. As of July 23, Fidelity reported holding 172,713.8841 bitcoin, before subsequent inflows or outflows. IBIT continues to lead with assets under management totaling about $47.0 billion. Fidelity

Is investor activity currently resulting in more deposits or withdrawals?

On July 29, FBTC saw an outflow of $43.1 million. Nonetheless, all U.S. spot bitcoin funds collectively posted an increase of $32.1 million that same day. The past four nonzero daily observations for FBTC were all outflows. Aggregate inflows since its launch are still around $9.968 billion. There continues to be demand, though it has lessened. Farside Investors

How does FBTC’s 0.25% fee compare to others?

The yearly fee is roughly $25 for each $10,000 invested. FBTC’s 0.25% fee is the same as IBIT’s. ARKB has a 0.21% fee, and both BITB and HODL charge 0.20%. GBTC is still the most expensive, with a 1.50% fee. Over long holding periods, small fee variations add up. MarketWatch

What are the key FBTC price points to watch today?

Immediate support is seen around the session low of $55.20 set on Wednesday. More substantial support is at the 52-week low of $50.48. Resistance begins near $56.30, with additional resistance coming in at the round number of $60. Based on approximately 0.00087 bitcoin per share, a $60,000 bitcoin price equates to about $52.20. If bitcoin reaches $70,000, the estimate rises to about $60.90. These figures are approximate correlations and not exact trading values. MarketWatch

What is the indication of the present 12-month outlook for FBTC?

Citi projected in July that bitcoin could reach $82,000 within twelve months, with a downside scenario of $53,000. At 0.00087 bitcoin per share, these targets translate to around $71 and $46, respectively. Based on Wednesday’s closing price, this implies a potential 29% gain or a 17% loss. Citi represents a single viewpoint, not overall market sentiment. Fidelity observes that some cycle analysts anticipate a market bottom in November 2026, though exact timing is still unclear. Reuters

What might shift the outlook most quickly?

Federal Reserve policymakers maintained interest rates at 3.50%–3.75% on July 29. The decision saw a 9–3 split, with three members voting for an increase. This hawkish division could maintain tight financial conditions. ETF flows continue to show volatility. A drop in bitcoin below $60,000 would weaken FBTC’s technical position, while prolonged trading above $70,000 would strengthen it. Federal Reserve

What major risk might investors not fully appreciate?

Fidelity reported bitcoin’s annualized volatility at 52.30% through 2025. Its historical daily returns varied from negative 15.43% to positive 15.26%. FBTC eliminates wallet management, but does not address bitcoin’s price volatility. The fund is not registered under the Investment Company Act of 1940. Custody issues, market structure, and regulatory lapses still pose substantial risks. Investors may lose most or all of their invested capital. Fidelity

Khadija Saeed is a financial markets reporter at TS2.tech, specializing in stocks, technology and emerging industries. She studied economics and finance at the London School of Economics and previously worked in market research before moving into financial journalism. Her coverage focuses on the companies, innovations and economic trends influencing global investors. Follow Khadija Saeed on Google News.

AI PORTFOLIO

Top Stock Picks

Today’s highest-ranked model selections.

#1 BUY ON PULLBACK

Microsoft

NASDAQ: MSFT 94 / 100
#2 BUY

L3Harris Technologies

NYSE: LHX 90 / 100
#3 BUY

Xylem

NYSE: XYL 89 / 100
#4 BUY IN TRANCHES

Lam Research

NASDAQ: LRCX 87 / 100
#5 BUY ON WEAKNESS

GE HealthCare

NASDAQ: GEHC 84 / 100
View full portfolio
Editorial model selection. Not personalised advice.
Microsoft (NASDAQ:MSFT) shares surge close to 9% after easing of AI order backlog tempers spending worries
Previous Story

Microsoft (NASDAQ:MSFT) shares surge close to 9% after easing of AI order backlog tempers spending worries

Qantas (ASX:QAN) Project Sunrise Test Flight Meets Range Target, Premium Fare Strategy Highlighted
Next Story

Qantas (ASX:QAN) Project Sunrise Test Flight Meets Range Target, Premium Fare Strategy Highlighted