Premarket price
$531.86
−1.52%
12,750 shares before hours
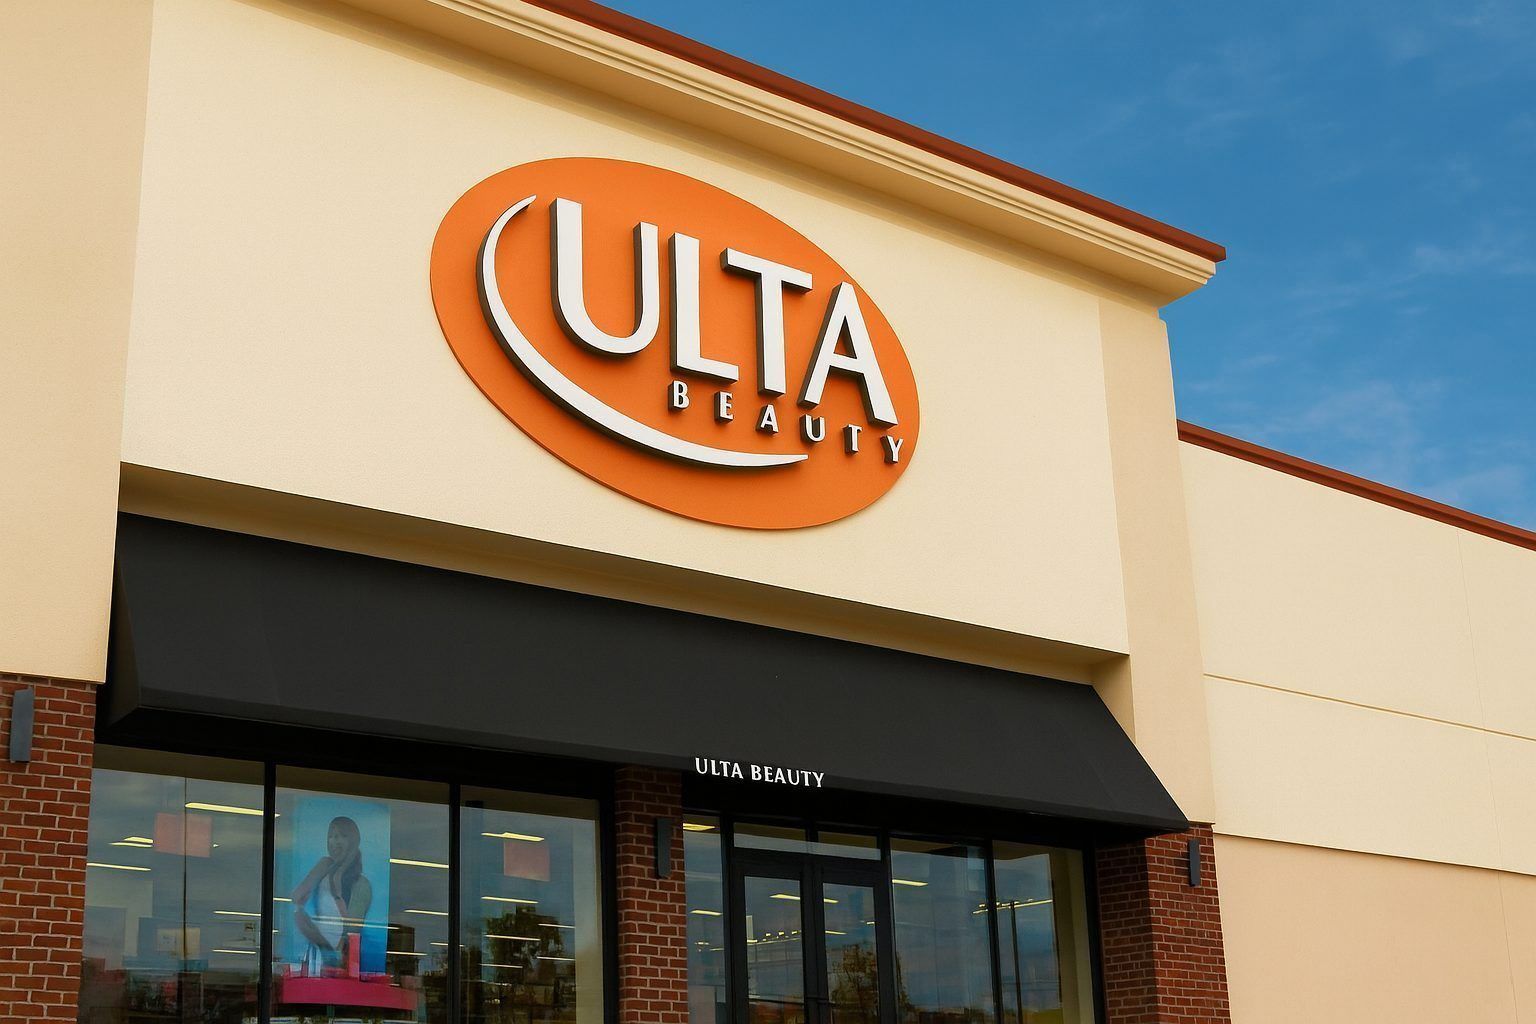
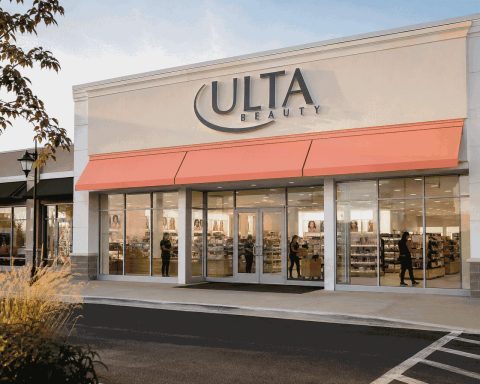
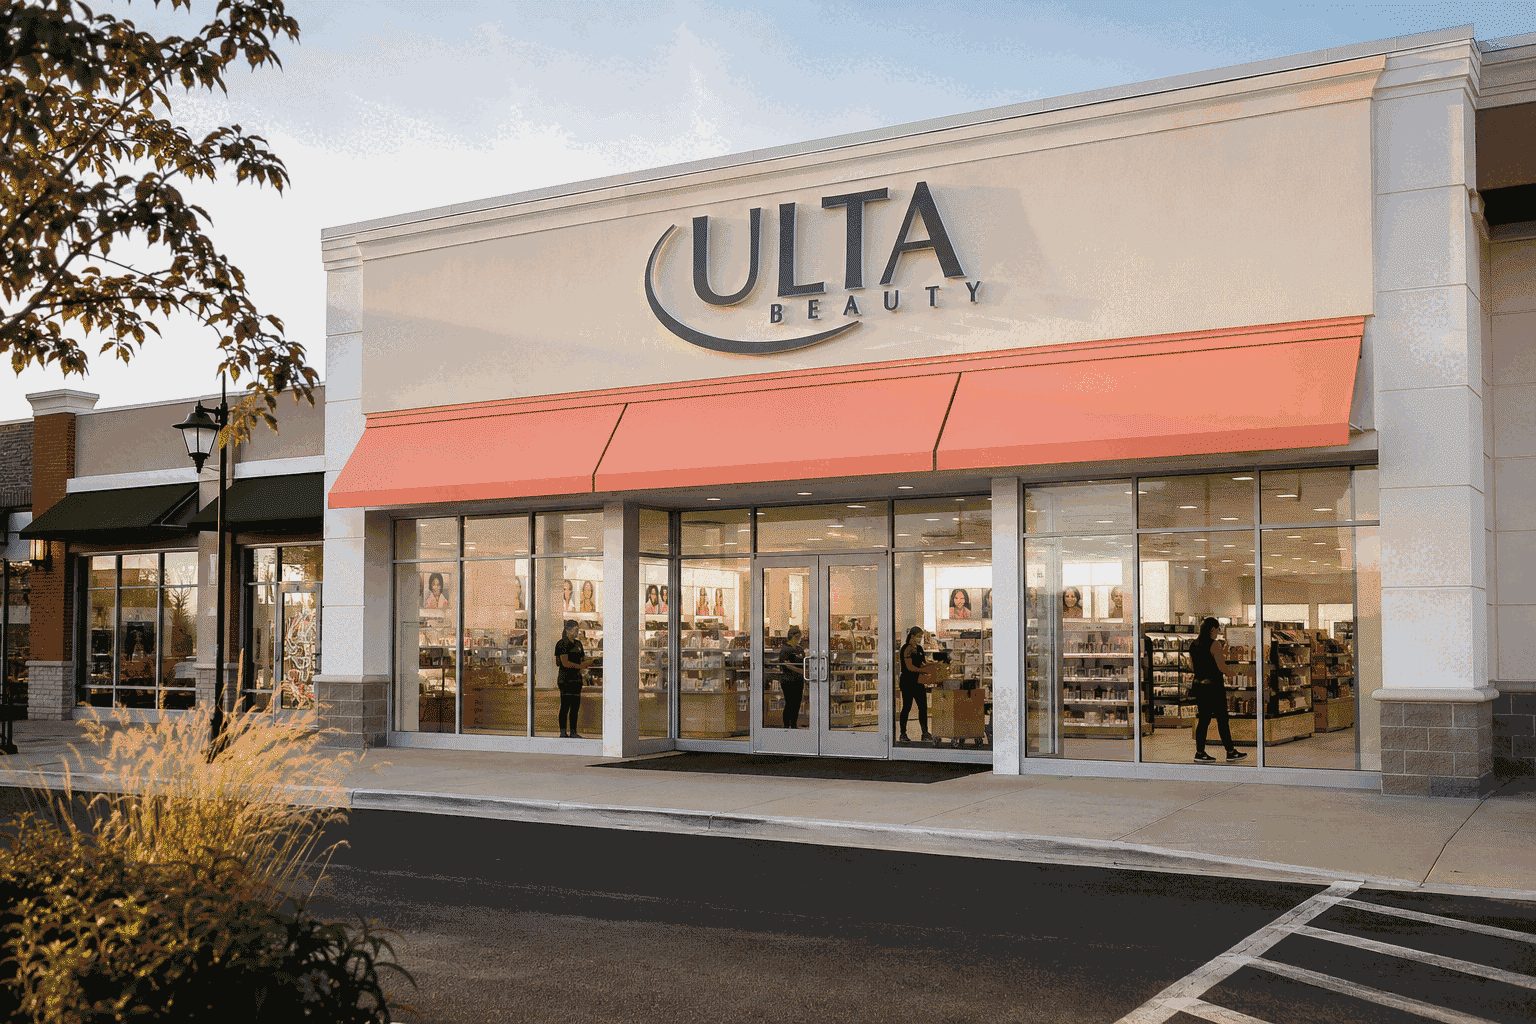
Ulta Beauty stock fell on Friday, even after the company surpassed quarterly expectations and raised its full-year outlook. The 1.5% drop before the market opened wiped out roughly $350 million in implied market capitalization.
The quarter beat consensus, but comparable growth slowed from 6.7% a year earlier and gross margin eased 10 basis points.
The one-month gain was 5.32% through Aug. 27, leaving less room for a merely good print.
| Fiscal 2026 | Prior | Updated |
|---|---|---|
| Net sales growth | 6.0%–7.0% | 6.7%–7.2% |
| Comparable sales | 2.5%–3.5% | 3.2%–3.7% |
| Operating income growth | 6.5%–9.0% | 8.3%–9.3% |
| Diluted EPS | $28.36–$28.80 | $28.70–$29.00 |
| Fiscal-year repurchases | $1.5B | $1.8B |
Bars share a $2.4 billion scale. Repurchases can support per-share earnings, but debt exceeds cash plus short-term investments.
| Signal | Current read | What changes the view |
|---|---|---|
| Demand | 3.8% comps; no reported trade-down | Holiday traffic and prestige mix |
| Margin | 39.1% gross; 12.5% operating | Space NK mix and markdowns |
| Inventory | $2.4B, roughly flat YoY | Sell-through versus new launches |
| Capital returns | $1.8B fiscal-year plan | Execution against $1.0B authorization remaining |
| Valuation | 20.24× trailing EPS | Evidence that raised guidance is conservative |
Ulta Beauty results
Reuters earnings report
MarketWatch quote
Google Finance listing
All figures are company-reported or cited to the timestamped market sources above. Rounded totals may not sum exactly.
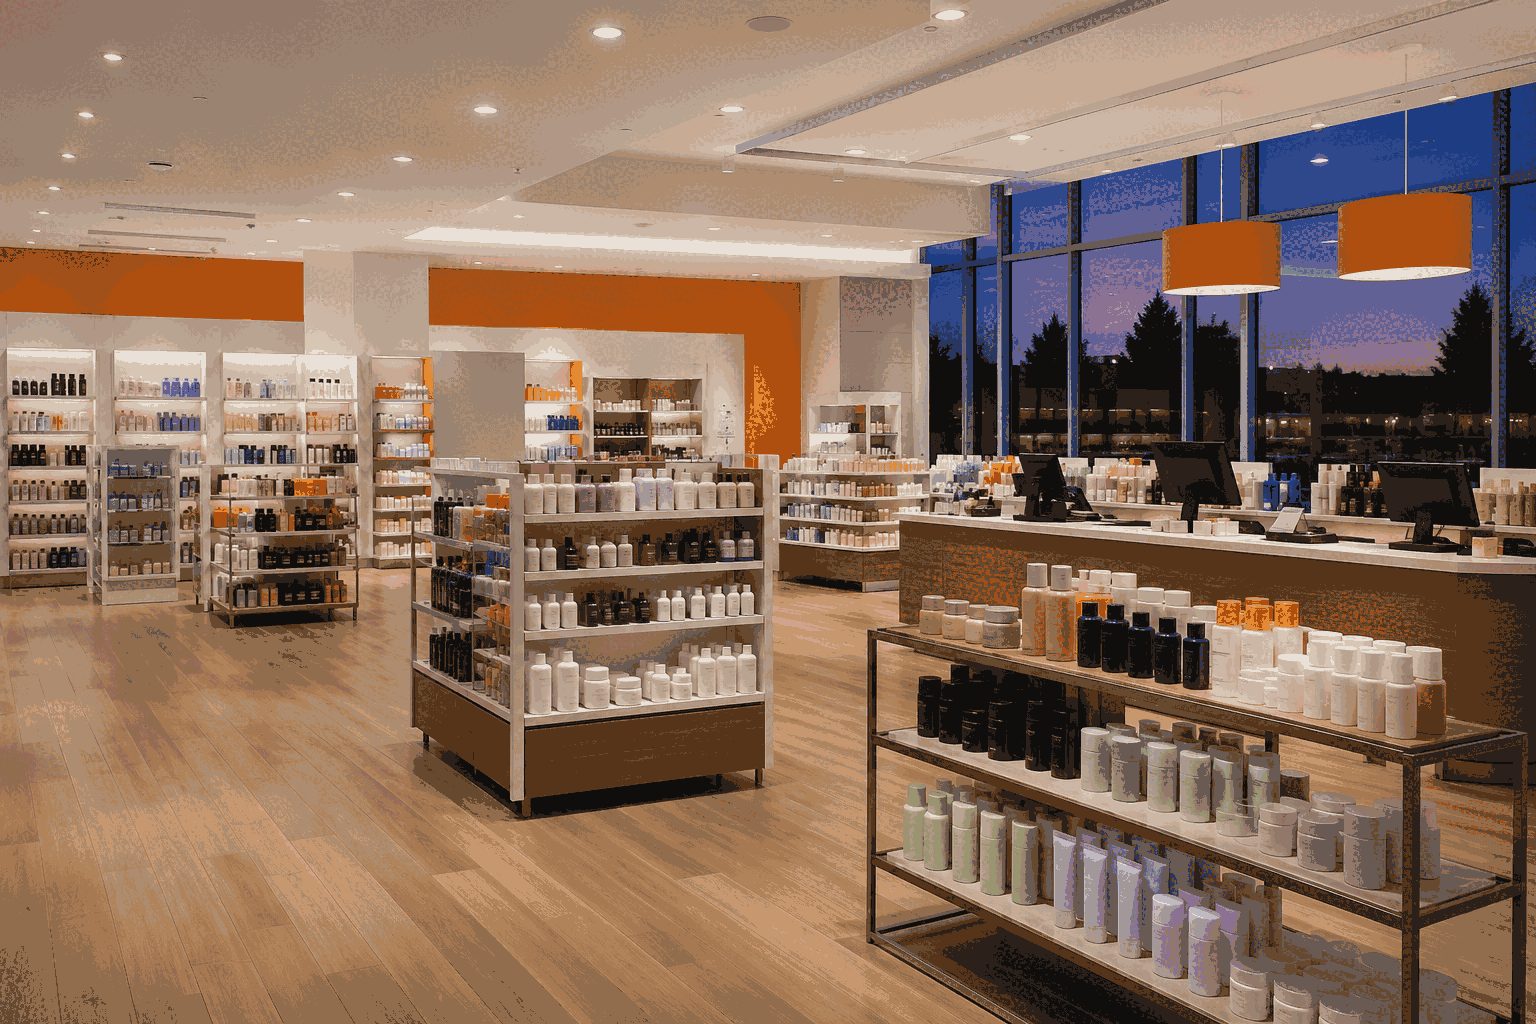
Revenue beat consensus by roughly $76 million and EPS beat by $0.36, yet the stock reversed lower. The raised annual EPS midpoint increased less than 1%, while gross margin slipped 10 basis points.
| Metric | Q2 FY25 | Q2 FY26 | YoY |
|---|---|---|---|
| Net sales | $2.788B | $3.036B | +8.9% |
| Comparable sales | 6.7% | 3.8% | −290 bp |
| Gross margin | 39.2% | 39.1% | −10 bp |
| Operating income | $344.9M | $379.6M | +10.1% |
| Diluted EPS | $5.78 | $6.55 | +13.3% |
| Metric | Prior | Updated |
|---|---|---|
| Sales growth | 6.0%–7.0% | 6.7%–7.2% |
| Comparable sales | 2.5%–3.5% | 3.2%–3.7% |
| Operating-income growth | 6.5%–9.0% | 8.3%–9.3% |
| Diluted EPS | $28.36–$28.80 | $28.70–$29.00 |
Watch: Space NK mix, comparable-sales deceleration, gross margin, inventory, consumer confidence and cash funding for repurchases.