
TOKYO, July 31, 2026, 17:20 JST
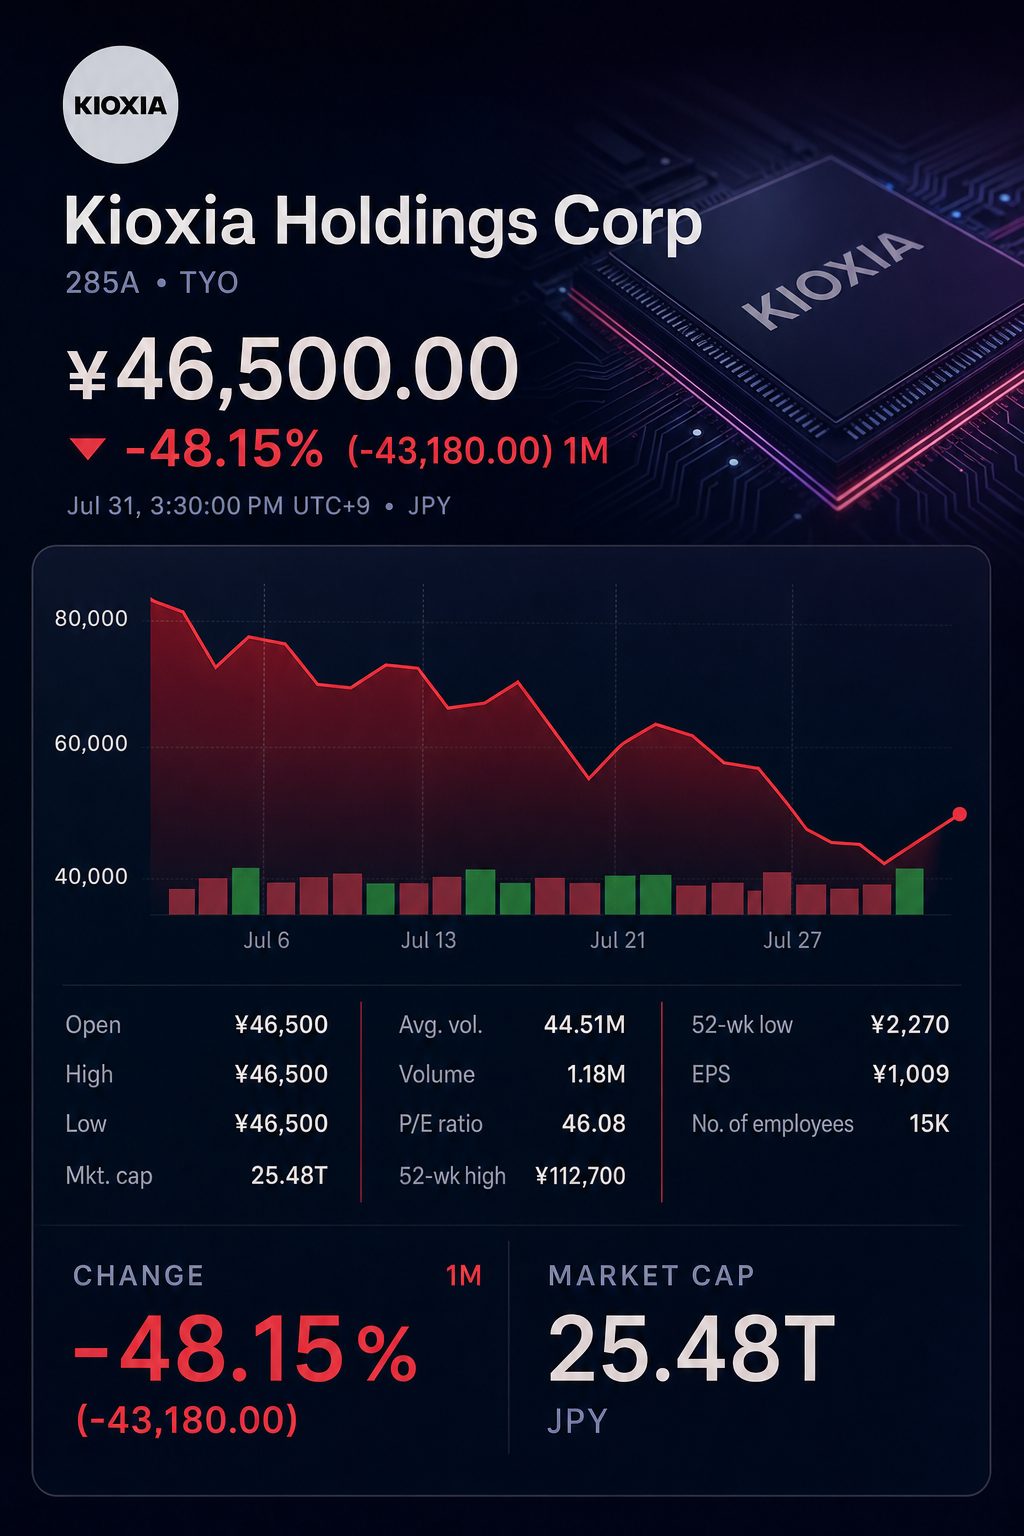
- Kioxia shares finished at ¥46,500, rising 17.72% on the day, though the stock fell 16.98% across five sessions.
- Operating profit forecast for July to September increased by 48.8% quarter-on-quarter, but fell short of the LSEG consensus by 3.1%.
- The ¥800 billion share repurchase represents around 3.1% of outstanding stock at Friday’s closing price. The interim dividend projection is unchanged at zero.
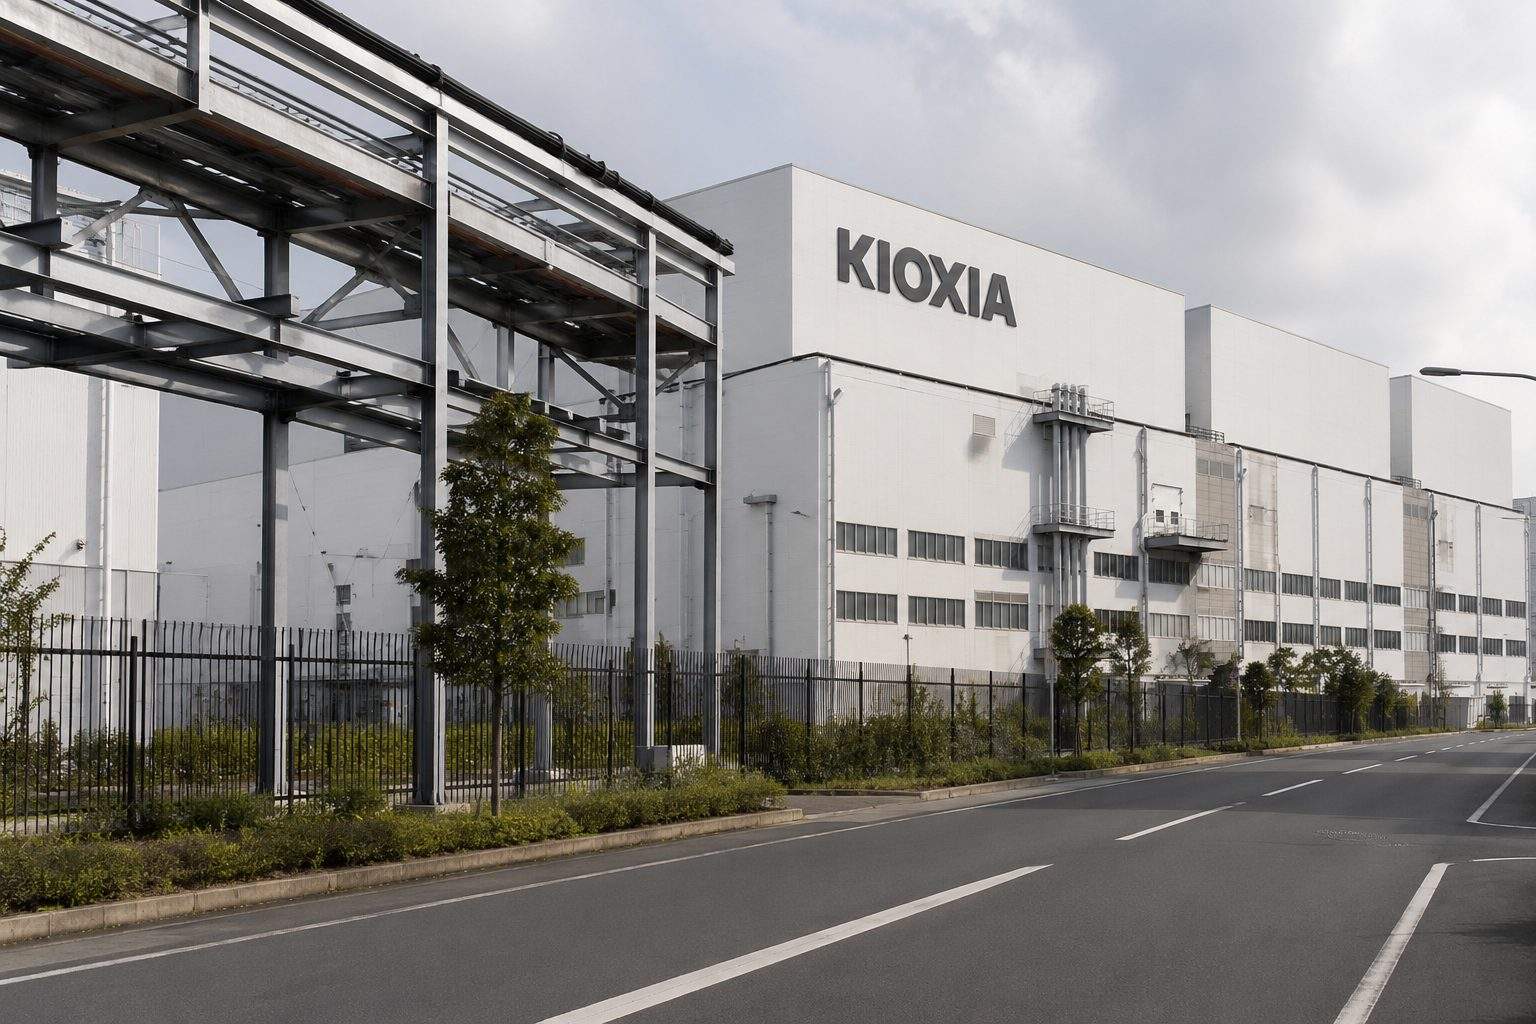
Kioxia Holdings TYO:285A unveiled an ¥800 billion share repurchase following the market close in Tokyo on Friday. The company projected operating profit for July-September at ¥1.89 trillion, coming in below the ¥1.95 trillion consensus forecast from eight analysts polled by LSEG.
Investors are chiefly concerned about the buyback’s price sensitivity. Based on Friday’s closing price, the available cash would purchase approximately 17.2 million shares, representing 3.1% of the company’s outstanding stock, rather than the 5.5% suggested by the headline cap.
Achieving 30 million shares would need an average price of about ¥26,667, which is 42.7% less than Friday’s closing value. Kioxia maintained its interim dividend projection at zero. The setup supports adaptable capital returns in the midst of a costly expansion phase.
| Buyback mechanics | Figure |
|---|---|
| Friday’s closing price | ¥46,500 |
| High over 52 weeks | ¥112,700 |
| Decline from peak | 58.7% |
| Total cash authorized | ¥800.0 billion |
| Maximum number of shares | 30.0 million |
| Declared share cap | 5.5% |
| Shares that can be bought at Friday’s close | 17.2 million |
| Realized percentage at Friday’s close | 3.1% |
| Average price to repurchase 30 million | ¥26,667 |
| Discount needed from Friday’s close | 42.7% |
Based on company filings and Friday market close data. Any percentages not specified in disclosures are derived from available figures.
Kioxia ended trading up 17.72% at ¥46,500 ahead of the results. However, the share price has declined 16.98% over the past five sessions and is still trading 58.7% below its all-time high of ¥112,700. Tokyo’s main cash market closed at 15:30 JST.
Forecasts continue to indicate a significant jump in earnings. Revenue is projected to climb 35.2% from the previous quarter ending in June. Operating profit is expected to grow by 48.8%. This suggests an operating margin of roughly 79.1%.
| Profit trajectory | Apr–Jun actual | Jul–Sep guide | Quarter-on-quarter | LSEG estimate | Guide vs estimate |
|---|---|---|---|---|---|
| Revenue | ¥1,767.1bn | ¥2,390.0bn | +35.2% | — | — |
| Operating profit | ¥1,270.0bn | ¥1,890.0bn | +48.8% | ¥1,950.0bn | −3.1% |
| Attributable profit | ¥842.2bn | ¥1,270.0bn | +50.8% | — | — |
| Operating margin | 71.9% | 79.1% | improved by 7.2 percentage points | — | — |
The LSEG number represents a consensus forecast and is not official company guidance. Margins and the difference from the consensus are derived from published data.
Revenue for April to June totaled ¥1.77 trillion, representing a 415.5% increase on the previous year. Operating profit stood at ¥1.27 trillion. Profit attributable to shareholders was ¥842.2 billion.
Kioxia’s balance sheet saw rapid improvement. The equity ratio climbed to 50.8%, up from 37.9% at the end of March. Over the quarter, total equity grew by roughly ¥1 trillion.
| Revenue by business | Mar quarter | Jun quarter | Sequential change | Jun-quarter mix |
|---|---|---|---|---|
| SSD and Storage | ¥600.3bn | ¥1,174.7bn | +95.7% | 66.5% |
| Smart Devices | ¥337.3bn | ¥525.7bn | +55.9% | 29.7% |
| Other | ¥65.2bn | ¥66.7bn | +2.3% | 3.8% |
| Total | ¥1,002.9bn | ¥1,767.1bn | +76.2% | 100.0% |
Kioxia’s segment data was used to determine sequential growth and sales-mix percentages.
SSD and Storage revenue almost doubled compared to the March quarter, accounting for two-thirds of sales in the June quarter. Smart Devices posted growth as well, though at a slower rate.
Kioxia attributed the rise chiefly to increased average selling prices, which were propelled by data center demand for generative-AI. The composition indicates profits are still closely tied to NAND prices.
| Capital-allocation benchmark | Amount | Maximum buyback as percentage |
|---|---|---|
| Top buyback limit | ¥800.0bn | 100% |
| June 30 cash holdings | ¥791.0bn | 101% |
| Operating cash flow, Q1 | ¥866.3bn | 92% |
| Targeted yearly capital investment | ¥470.0bn | 170% |
| Planned annual capex and R&D | ¥700.0bn | 114% |
This authorization represents a maximum limit rather than approved expenditure. The ratios are based on figures provided by the company.
The buyback cap marginally surpasses the ¥791 billion cash held at quarter end and accounts for 92% of operating cash flow from the first quarter. Kioxia, though, reported ¥866.3 billion in operational cash flow for the quarter.
The company repaid ¥433.2 billion in long-term loans, cutting total bonds and borrowings by ¥413 billion. This leaves management with a more robust balance sheet and additional flexibility.
However, the maximum amount set for the buyback is 170% of the company’s planned yearly capital outlays. Kioxia forecasts annual capital expenditures of roughly ¥470 billion. Annual research and development spending is estimated at ¥230 billion. The buyback filing notes that there is a possibility that some or all of the shares may not be bought.
Chief Executive Hiroo Ota stated that Kioxia will “fully meet growing market demand” through the expansion of Fab2. Kazuyoshi Saito, an analyst at IwaiCosmo Securities, noted that the company’s NAND technology is “two to four years ahead of rivals.” Reuters
Rivalry in the sector is intensifying. SK Hynix KRX:000660 intends to invest 80 trillion won in constructing a new NAND facility. The move highlights the potential for current supply constraints to lessen over time.
Kioxia announced a three-for-one stock split effective October 1, with a record date set for September 30. The company stated the split aims to reduce the minimum investment and broaden its pool of investors.
Risks: NAND pricing is still subject to cycles. Margins and share support could decline if capacity increases rapidly, AI investment slows, the yen fluctuates, or buybacks fall short.
The buyback period begins on Monday, August 3, and continues until October 30. Investors are set to gauge next week if real buying activity compensates for the slight shortfall in guidance.
Related articles: Semiconductors