
New York, July 15, 2026, 09:14 (EDT).
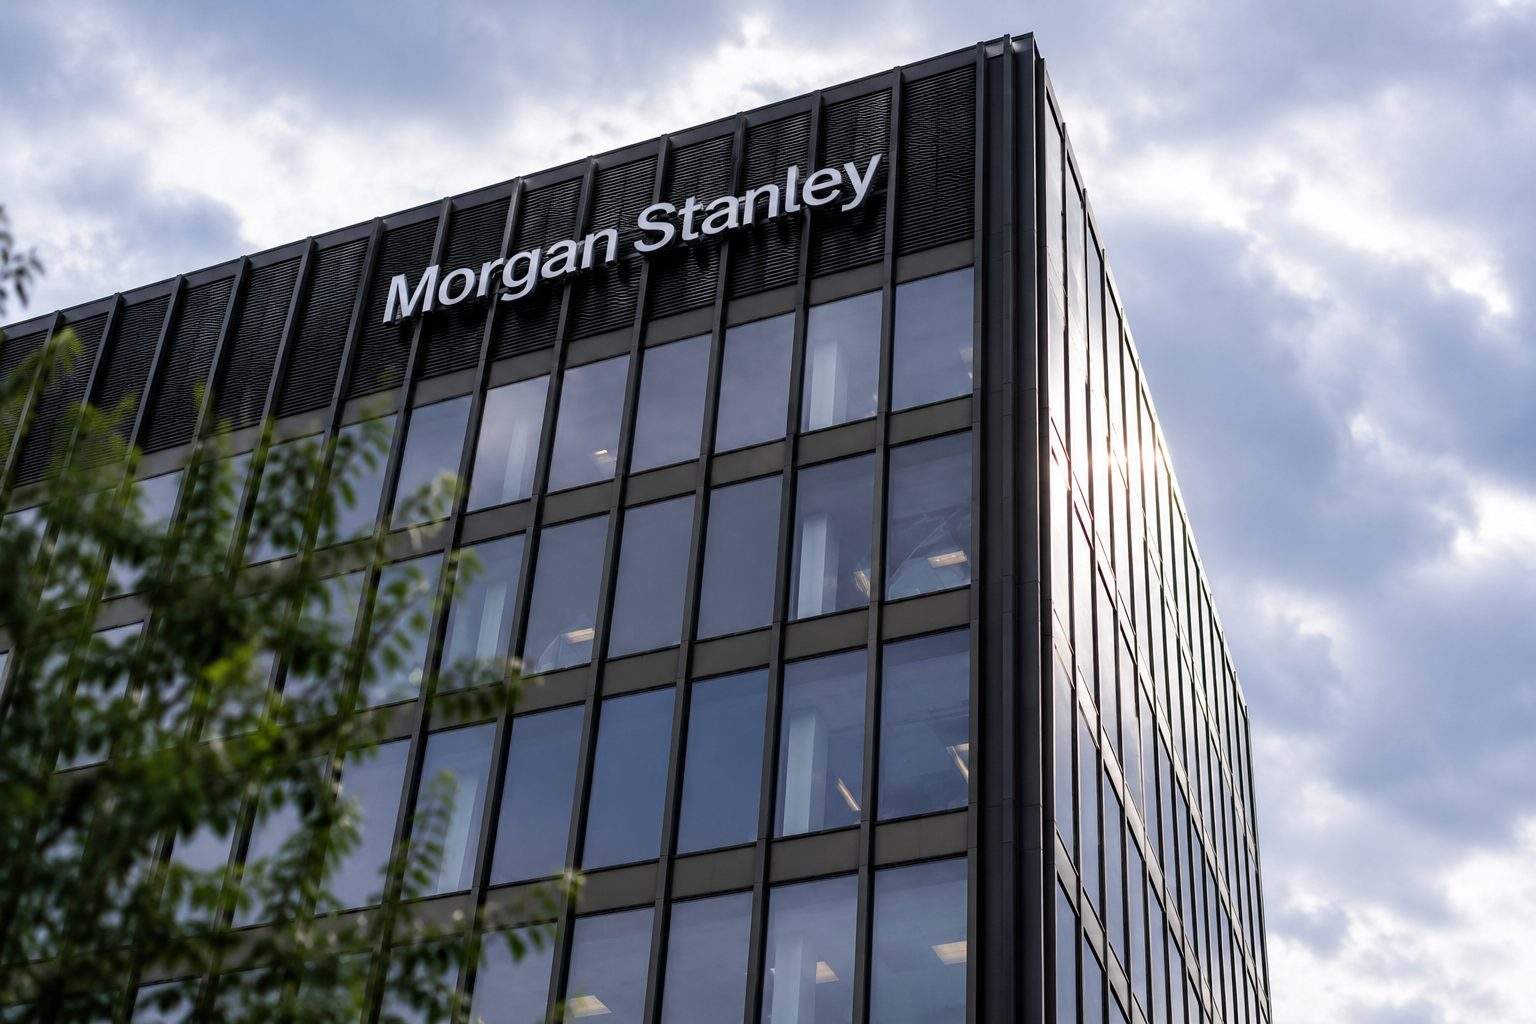
Morgan Stanley NYSE:MS delivered a record second quarter, but the upside was more concentrated than the headline figures suggest. Its equity-trading desk beat the StreetAccount estimate by about $1.9 billion, larger than the bank’s roughly $1.71 billion total-revenue beat against a separate consensus compiled by LSEG LON:LSEG.
That mix matters because wealth fees recur with client assets, while trading revenue rises and falls with volumes and volatility. The shares were about 1% higher before Wednesday’s opening bell and had gained 28.5% in 2026, making the source of the earnings surprise as relevant as its size.
The wealth headline also needs a quality check. More than half of the $148.1 billion in net new assets came from IPO-related inflows in Morgan Stanley’s workplace channel, which means less than roughly $74 billion came from all other sources by simple subtraction. Fee-based asset flows, which track activity in accounts charged on assets, fell to $39.1 billion, down 27% from the first quarter and 9% from a year earlier.
The estimate panels differ, so the cross-metric comparison is directional rather than a formal bridge from the trading desk to group revenue.
| Q2 2026 metric | Reported | Analyst estimate | Beat |
|---|---|---|---|
| Net revenue | $21.35 billion | $19.64 billion | $1.71 billion, or 8.7% |
| Diluted EPS | $3.46 | $2.94 | $0.52, or 17.7% |
| Equity-trading revenue | $6.30 billion | About $4.40 billion | About $1.90 billion, or 43.2% |
Sources: Morgan Stanley; LSEG and StreetAccount estimates reported by Quartz.
Net income applicable to Morgan Stanley rose 58% to $5.58 billion. Return on tangible common equity, a profit measure against shareholder capital, reached 26.6%, up from 18.2% a year earlier. The efficiency ratio, where lower is better, improved to 65% from 71%. “Active markets and consistent execution across all three regions drove exceptional results,” Chief Executive Ted Pick said. Morgan Stanley
Institutional Securities revenue climbed 44% to $11.04 billion. Investment banking rose 58% to $2.44 billion and fixed income increased 13% to $2.46 billion, while equities reached a record $6.3 billion, with the bank citing particular strength in Asia.
Wealth Management revenue rose 14% to $8.86 billion and its pre-tax margin reached 30.5%. Combined client assets across Wealth and Investment Management hit $10 trillion. “This was a client-led-activity quarter across institutional and retail,” Chief Financial Officer Sharon Yeshaya told Bloomberg. Bloomberg Law News
| Firm | Q2 equity-trading revenue | Change from a year earlier |
|---|---|---|
| Goldman Sachs Group NYSE:GS | $7.42 billion | 72% |
| Morgan Stanley NYSE:MS | $6.30 billion | 69% |
| JPMorgan Chase NYSE:JPM | $6.00 billion | 86% |
Sources: Company earnings releases.
The comparison shows that the trading spike was sector-wide, not unique to Morgan Stanley. Its more lasting advantage would come from retaining the workplace liquidity created by IPOs and shifting more of those assets into fee-paying adviser accounts.
The board lifted the quarterly dividend to $1.15 from $1.00 and reauthorized up to $20 billion of share buybacks beginning in the third quarter, with no set expiry. Standardized CET1, a measure of core loss-absorbing capital, was estimated at 14.8% and remains subject to change in the quarterly filing.
But the risk is that both engines cool at once. Equity trading can reverse quickly if volatility and volumes ease, while IPO-linked assets may leave rather than move into managed accounts. Non-compensation costs rose 19% to $5.72 billion, adding pressure if revenue returns to more normal levels.
Morgan Stanley has scheduled its third-quarter results for Oct. 14. Before then, the more useful evidence will be whether fee-based flows rebound and whether the IPO-sourced workplace assets remain with the firm. That will separate a strong trading quarter with a large asset transfer from a lasting increase in earnings power.
Related articles: NYSE:MS






![Australia Stock Market Today 28/08/2026 [UPDATE: 10:37 AEST] [ASX Rebounds as Tech and Energy Offset Bank Weakness]](https://ts2.tech/wp-content/uploads/2026/08/AU-market-dashboard-2026-08-28-1034-480x384.jpg "Australia Stock Market Today 28/08/2026 [UPDATE: 10:37 AEST] [ASX Rebounds as Tech and Energy Offset Bank Weakness]")