
HOUSTON, August 18, 2026, 16:10 CDT — U.S. cash markets remained shut.
- Occidental gained 1.3%, closing at $59.80 after Brent hit its highest level in three weeks.
- Brent stayed 5.9% under the oil price Occidental realized in the second quarter.
- The average price target from analysts, at $64.83, suggests an 8.4% potential rise from Tuesday’s closing level.
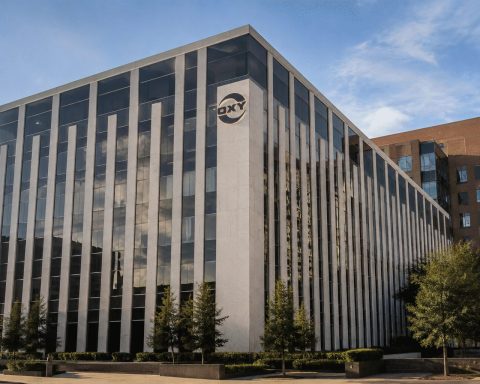
Occidental Petroleum Corporation NYSE:OXY rose 1.3% on Tuesday after crude prices climbed further, with the Strait of Hormuz dispute intensifying.
Shares ended at $59.80, marking a third consecutive rise. Brent crude closed at $91.02, reaching its highest point since July 24. U.S. crude settled at $84.94.
| Market measure | August 18 close | Daily move | Investor read-through |
|---|---|---|---|
| Occidental NYSE:OXY | $59.80 | +1.29% | Oil-linked gains, though reaction muted |
| Brent crude | $91.02/bbl | +0.17% | Highest level in three weeks |
| WTI crude | $84.94/bbl | +0.52% | Peaks at three-week high |
| S&P 500 | 7,691.76 | -0.69% | Energy rises as broader market lags |
Iran stated that the strait would stay closed until the United States agreed to its conditions. The U.S., however, maintained that the waterway was accessible. Vessel movement stayed below ten, not counting ships without active transponders.
In 2024, the chokepoint handled 20 million barrels per day, representing around 20% of worldwide petroleum liquids consumption. Saudi Arabia and the UAE together had just 2.6 million barrels per day of alternative bypass capacity.
However, Occidental’s advance was outpaced by other energy companies. Shares of EOG Resources, Inc. NYSE:EOG were up 1.7%. Chevron Corporation NYSE:CVX finished 1.5% higher, and Devon Energy Corporation NYSE:DVN rose 0.6%.
| Producer | August 18 move | Gap versus OXY |
|---|---|---|
| EOG Resources NYSE:EOG | up 1.74% | lead by 0.45 percentage point |
| Chevron NYSE:CVX | rose 1.50% | higher by 0.21 point |
| Occidental NYSE:OXY | gained 1.29% | Reference |
| Devon Energy NYSE:DVN | advanced 0.55% | lagged by 0.74 point |
The primary difference lies in pricing, rather than output. In the second quarter, Occidental achieved a global average of $96.78 per barrel. Brent settled on Tuesday at a level 5.9% under that figure, while WTI was trading 8.5% beneath Occidental’s quarterly average.
| OXY operating measure | Second quarter 2026 | Current comparison |
|---|---|---|
| Worldwide realized crude price | $96.78/bbl | Brent settled 5.9% lower |
| WTI benchmark | $92.79/bbl | WTI on Tuesday declined 8.5% |
| Global production | 1.433 million boe/day | Exceeded company outlook |
| Free cash flow before working capital | $3.0 billion | Roughly 5.0% of present market cap |
| Principal debt | $11.8 billion | Reduced by $1.9 billion in the quarter |
The oil rally is put into perspective by the cash result. Occidental reported $3.0 billion in free cash flow for the quarter before adjusting for working capital. That corresponds to about 5% of its $59.8 billion equity value as of Tuesday. This is not intended as a projection for the full year.
Chief Executive Richard Jackson stated the company continues to prioritize financial stability and cost-saving measures. Occidental reduced its principal debt by $1.9 billion, with $1.8 billion left to reach the next $10 billion target.
Occidental shares are up 1.3% since August 11, but price momentum remains subdued. The stock trades 11.3% beneath its $67.45 peak for the year, even with crude oil prices lifted by geopolitical tensions.
| Date | OXY close | Change from August 11 |
|---|---|---|
| August 11 | $59.06 | — |
| August 12 | $58.55 | -0.9% |
| August 13 | $57.70 | -2.3% |
| August 14 | $58.36 | -1.2% |
| August 17 | $59.04 | 0.0% |
| August 18 | $59.80 | up 1.3% |
Analysts similarly allow minimal scope for gains driven solely by geopolitical factors. The consensus price target is $64.83, implying a potential 8.4% increase. However, the projected $45-to-$79 range highlights significant oil-price volatility.
| Analyst recommendation measure | Count or target | Versus $59.80 close |
|---|---|---|
| Buy ratings | 10 | 38% of 26 ratings |
| Hold ratings | 16 | 62% of 26 ratings |
| Consensus | Hold | — |
| Average target | $64.83 | +8.4% |
| Lowest target | $45.00 | -24.7% |
| Highest target | $79.00 | +32.1% |
The market could be factoring in potential supply relief. Bannockburn Capital Markets’ Darrell Fletcher noted that covert shipments were helping to stabilize prices. Jefferies economist Mohit Kumar continues to foresee short-term pressure and elevated oil prices.
Risks: Renewed diplomacy may remove the risk premium from crude. Additional attacks might push prices higher, while also potentially hindering logistics, impacting demand, and affecting global markets. Occidental’s exposure to domestic gas continues to act as a counterbalance, following weak second-quarter results.
For investors, the key level is $96.78. Oil prices maintained close to Occidental’s second-quarter average would back cash flow. If the Hormuz surge proves temporary, the share’s outlook hinges on debt repayment and operational performance.
Data reflect market close as of August 18. Analyst statistics are based on 26 ratings and price targets gathered on August 18.
Related articles: NYSE:OXY


Occidental Petroleum
Hormuz risk lifted crude and OXY, but the investable threshold remains the $96.78 per barrel realized price that powered second-quarter cash flow.
$59.80
▲ 1.29% · third straight gain
$91.02
▲ 0.17% · three-week high
$59.78B
9.24× trailing earnings
8.4%
Average target: $64.83
Six-session price path
Oil-price test
Tuesday's geopolitical premium still left Brent below the price behind OXY's second-quarter cash surge.
Second-quarter engine
*Before working capital, continuing operations.
Balance-sheet runway
Another $1.8B reduction reaches management's next marker.
Wall Street range
26 ratings: 10 Buy, 16 Hold. Consensus: Hold.