
SCHD Reaches 52-Week Peak, Boosting $1,000 Monthly Payout Price to Almost $388,000
28 July 2026
2 mins read

SCHD Reaches 52-Week Peak, Boosting $1,000 Monthly Payout Price to Almost $388,000

NEW YORK, July 28, 2026, 13:58 EDT — U.S. markets open

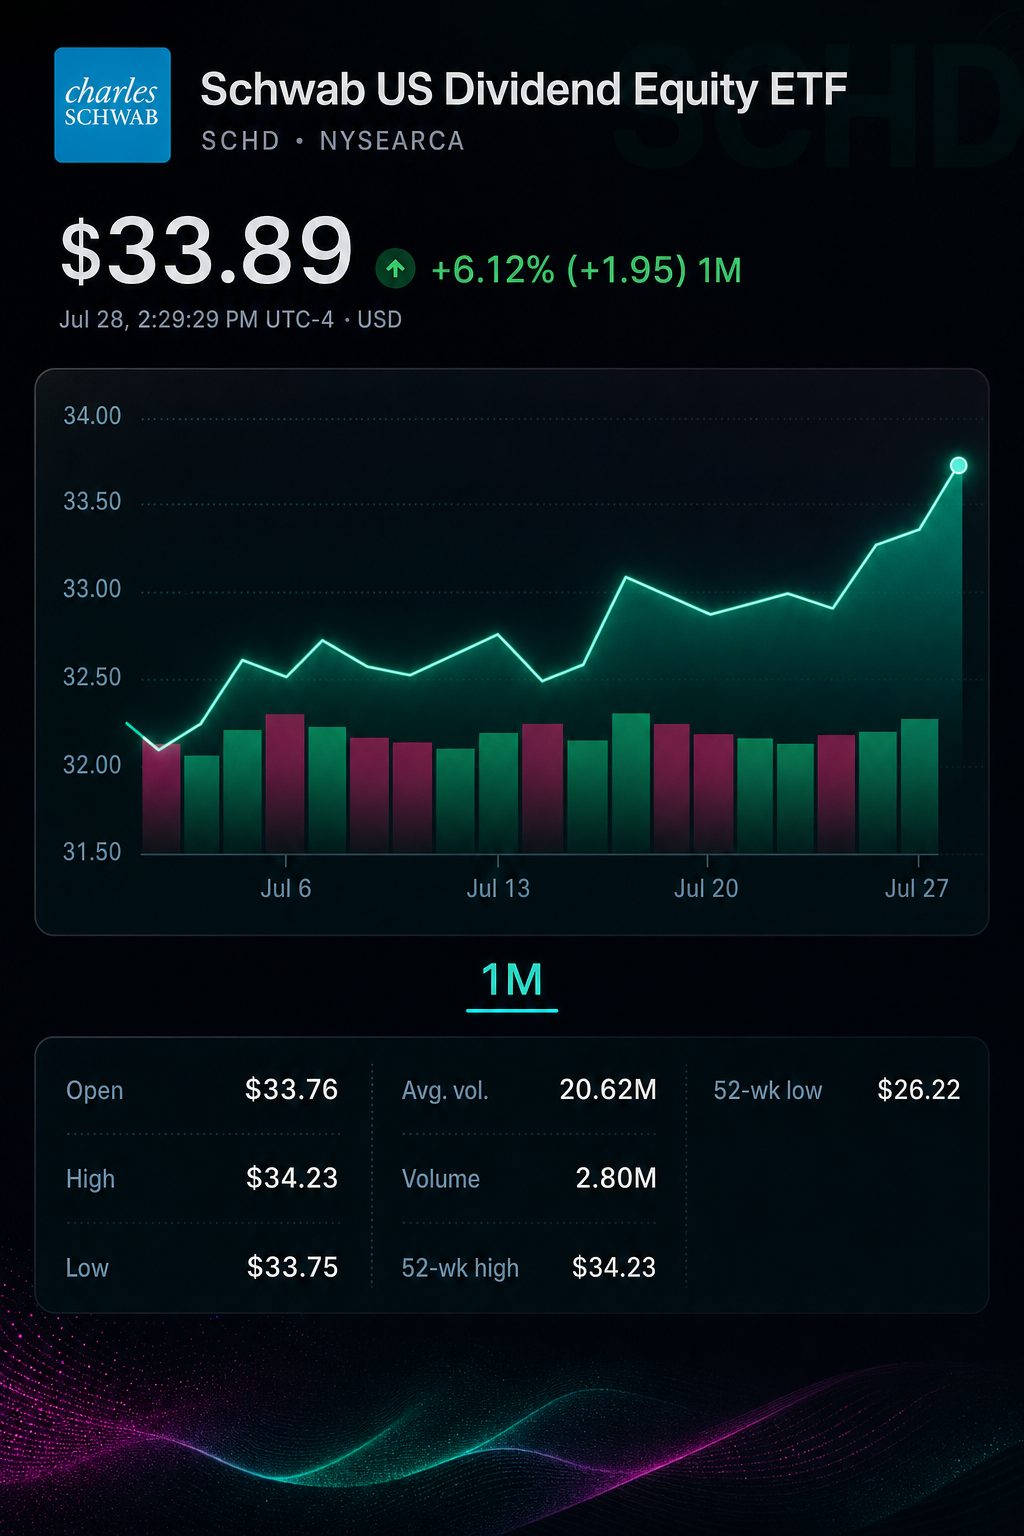
  • Schwab U.S. Dividend Equity ETF gained 1.3% to $33.88, reaching a 52-week peak of $34.24.
  • The most recent four payouts amounted to $1.048 per share, reflecting a trailing cash yield of 3.09% based on Tuesday’s closing price.
  • Initial projection: To earn $12,000 per year through paid distributions, approximately $387,900 is needed, which is 6.7% higher than the figure in the linked article.

SCHD was up 1.3% at $33.88 during early afternoon trade, after reaching $34.24, marking a 52-week high. The SPDR S&P 500 ETF Trust advanced 0.3%.

The fund benefited from market rotation on Tuesday. According to Reuters, gains in consumer staples and health-care stocks counterbalanced sharp declines in chipmaker shares. These sectors represent significant portions of SCHD’s holdings.

Stock chart for NYSEARCA:SCHD

The rally continued SCHD’s strong 2026 performance, with total returns climbing to 23.88% as of Monday. In comparison, the Vanguard S&P 500 ETF posted an 8.99% return, resulting in a 14.9-point difference.

However, the surge has increased the cost of fresh income investments. An analysis from July 26 calculated that about $364,000 would be needed to generate $12,000 per year in dividends, based on a steady 3.3% yield.

On July 24, Schwab posted a 30-day SEC yield of 3.28%. Based on this rate, the pre-tax threshold is approximately $365,900. SCHD distributes dividends quarterly, so $3,000 must be generated every quarter.

Real cash distributions result in a higher number. SCHD’s four most recent payouts added up to $1.048 per share. With a share price of $33.88, this represents a trailing cash yield of 3.09%.

An initial estimate indicates that 11,451 shares are necessary. Purchasing these shares at Tuesday’s listed price would amount to approximately $387,900.

The table shows a comparison of the two SCHD methodologies alongside leading dividend peers. Peer metrics are based on the most recent SEC yields published by each sponsor and do not factor in taxes.

Fund or calculation methodYield basisCapital for $12,000 yearlyExpense ratio
SCHD, SEC yield reported3.28%$365,9000.06%
SCHD, previous distributions paid3.09%$387,9000.06%
Vanguard High Dividend Yield ETF 2.25%$533,3000.04%
iShares Core Dividend Growth ETF 1.98%$606,1000.08%
Vanguard Dividend Appreciation ETF 1.52%$789,5000.04%

The trailing-cash estimate is roughly $24,300 higher than the figure reported on July 26. The gap is due to differences in yield calculations and SCHD’s elevated market value.

The 30-day SEC yield projects income over a year based on the prior month’s earnings. The trailing approach reflects distributions that have already been issued. Neither approach ensures future income.

SCHD’s distribution growth in the first half was minimal. The fund distributed $0.5094 per share in the first half of 2026, compared to $0.5090 in the same period of 2025.

This marks an initial rise of just 0.08%. Two more quarterly payouts are expected before a complete year-over-year comparison can be determined.

Yield is not the sole factor behind SCHD’s dominance in the market. “The first is the resurgence of the value factor,” Tony Dong wrote Sunday. Dong serves as lead ETF analyst at ETF Central. He also highlighted the fund’s larger weighting in energy. 24/7 Wall St.

Portfolio valuations back up that point. On June 30, SCHD had a price-to-earnings ratio of 18.41. On Monday, DGRO was trading at 24.42 times earnings.

The concentration brings an income edge. On Monday, health care, consumer staples and energy made up 55.17% of SCHD’s holdings. The fund’s top ten stocks comprised 41.46% of its portfolio.

SCHD consisted of 103 holdings, whereas DGRO included 390. SCHD’s portfolio turnover stood at 42.28% as of June 30. Sector allocation can shift rapidly due to annual index rebalancing.

Risks: The 3.28% SEC yield does not guarantee future distributions. Dividends from portfolio companies may be cut. If value stocks or defensive sectors lose momentum, SCHD’s edge heading into 2026 could shrink.

SCHD maintains a lower capital requirement compared to its leading dividend competitors. However, recent price gains have reduced the cash yield accessible to recent purchasers. For income-focused investors, immediate cash distributions outweigh simple headline yield figures.

What is SCHD’s current trading level, and has it set a new high?

At 1:41 p.m. EDT on July 28, SCHD was at $33.88, up $0.45 or approximately 1.35%. The session peak hit $34.24, equaling Schwab’s stated 52-week high. Trading volume reached 18.66 million shares by that time. Schwab Brokerage

Did SCHD surpass the performance of large-value peers in 2026?

SCHD posted a total return of 17.50% for 2026 through June 30. In comparison, the Morningstar large-value category gained 11.30% for that same period. Over one year, SCHD outpaced with a 24.03% return, ahead of 21.21%. But over three years annualized, SCHD trailed, returning 13.52% versus the category’s 16.13%. Schwab Brokerage

How much income does SCHD provide, and is the distribution increasing?

Schwab posted a 30-day SEC yield of 3.28% as of July 24. Its distribution yield for the trailing period was 3.30% on June 30. SCHD distributed $0.2569 in March and $0.2525 in June. Combined payouts for the first half reached $0.5094, up from $0.5090 in the prior year. This marks an increase of just 0.08%. The upcoming payout has not been announced yet. Schwab Brokerage

What is SCHD’s current level of concentration?

As of July 27, the top ten holdings made up 41.46% of total assets. Abbott had the largest weighting at 4.62%, with Merck in second place at 4.39%. Health care and consumer staples combined represented 41.10% of the fund’s assets. Including energy, those three sectors together made up 55.17% of the total. The level of concentration is significant. Schwab Brokerage

Which holdings are set for major catalysts this week?

Chevron accounts for 3.86% of SCHD and is set to release earnings on Friday, July 31. Merck has a 4.39% portfolio weight and reports earnings Tuesday, August 4. A 5% fluctuation in either share price would impact SCHD by an estimated 0.19 to 0.22 percentage points. This projection assumes no change in weights and no counteracting shifts in other holdings. Schwab Brokerage

What is the significance of Wednesday’s Federal Reserve decision for SCHD?

The FOMC is set to convene on July 28–29, with its policy announcement scheduled for Wednesday at 2:00 p.m. EDT. Market pricing suggests roughly a 65% chance that interest rates will hold steady. The 3.50%–3.75% target range has been maintained since December 2025. Any unexpected rate increase may weigh on dividend valuations as government yields draw comparison. The market response remains unclear. Federal Reserve

Has SCHD become pricey as it nears its 52-week peak?

As of June 30, Schwab’s portfolio price-to-earnings ratio stood at 18.41. The price-to-book ratio was reported at 3.67, and return on equity for the portfolio hit 26.95%. SCHD is also trading close to its 52-week high of $34.24. These figures alone do not indicate overvaluation, as comparison with peers remains important. Schwab Brokerage

Is SCHD still affordable to hold and simple to trade?

SCHD has an annual expense ratio of 0.06%, meaning investors pay roughly $6 for every $10,000 committed. Net assets reached $103.19 billion at the July 27 close. The median 30-day bid-ask spread stood at 0.03%. By early afternoon Tuesday, intraday volume had surpassed 18.6 million shares. The fund is among the largest and most actively traded. Schwab Brokerage

Iwona Majkowska is a financial markets journalist at TS2.tech, specializing in stocks, artificial intelligence and technology. A graduate of the Warsaw School of Economics, she previously worked in equity research and financial analysis before focusing on market reporting. Her daily coverage helps investors follow major developments across U.S. and global markets. Follow Iwona Majkowska on Google News.

Google Preferred Source

TS2 Tech on Google
Follow TS2 Tech

Choose TS2 Tech as a preferred source or open our publication in Google News.

Stock Market Today

  • ASX Penny Stocks In Focus For July 2026
    July 28, 2026, 3:29 PM EDT. The ASX 200 falls as global selling pressures and tech sector headwinds persist, but penny stocks such as Fleetwood Limited (ASX:FWD) and Renascor Resources (ASX:RNU) remain in the spotlight for their potential. Fleetwood, with a market cap of A$201.97M, specializes in modular construction and is pursuing growth following a recent restructuring despite higher expenses. Renascor, valued at A$150.23M, is progressing in battery material technology through new plants and collaborations. Both companies are debt-free and continue to attract investor attention in spite of varied earnings results.
Palantir delivers Q2 beat but faces $118 million challenge in H2
Previous Story

Palantir delivers Q2 beat but faces $118 million challenge in H2

Dell (NYSE:DELL) stock slides as AI-server customer concentration comes into focus
Next Story

Dell (NYSE:DELL) stock slides as AI-server customer concentration comes into focus