
NEW YORK, August 5, 2026, 08:07 EDT — U.S. premarket.
SoFi Technologies has bounced back, fully recovering its losses from the earnings-day decline. Now, investors will require greater profit growth than implied by the company’s sales outlook.
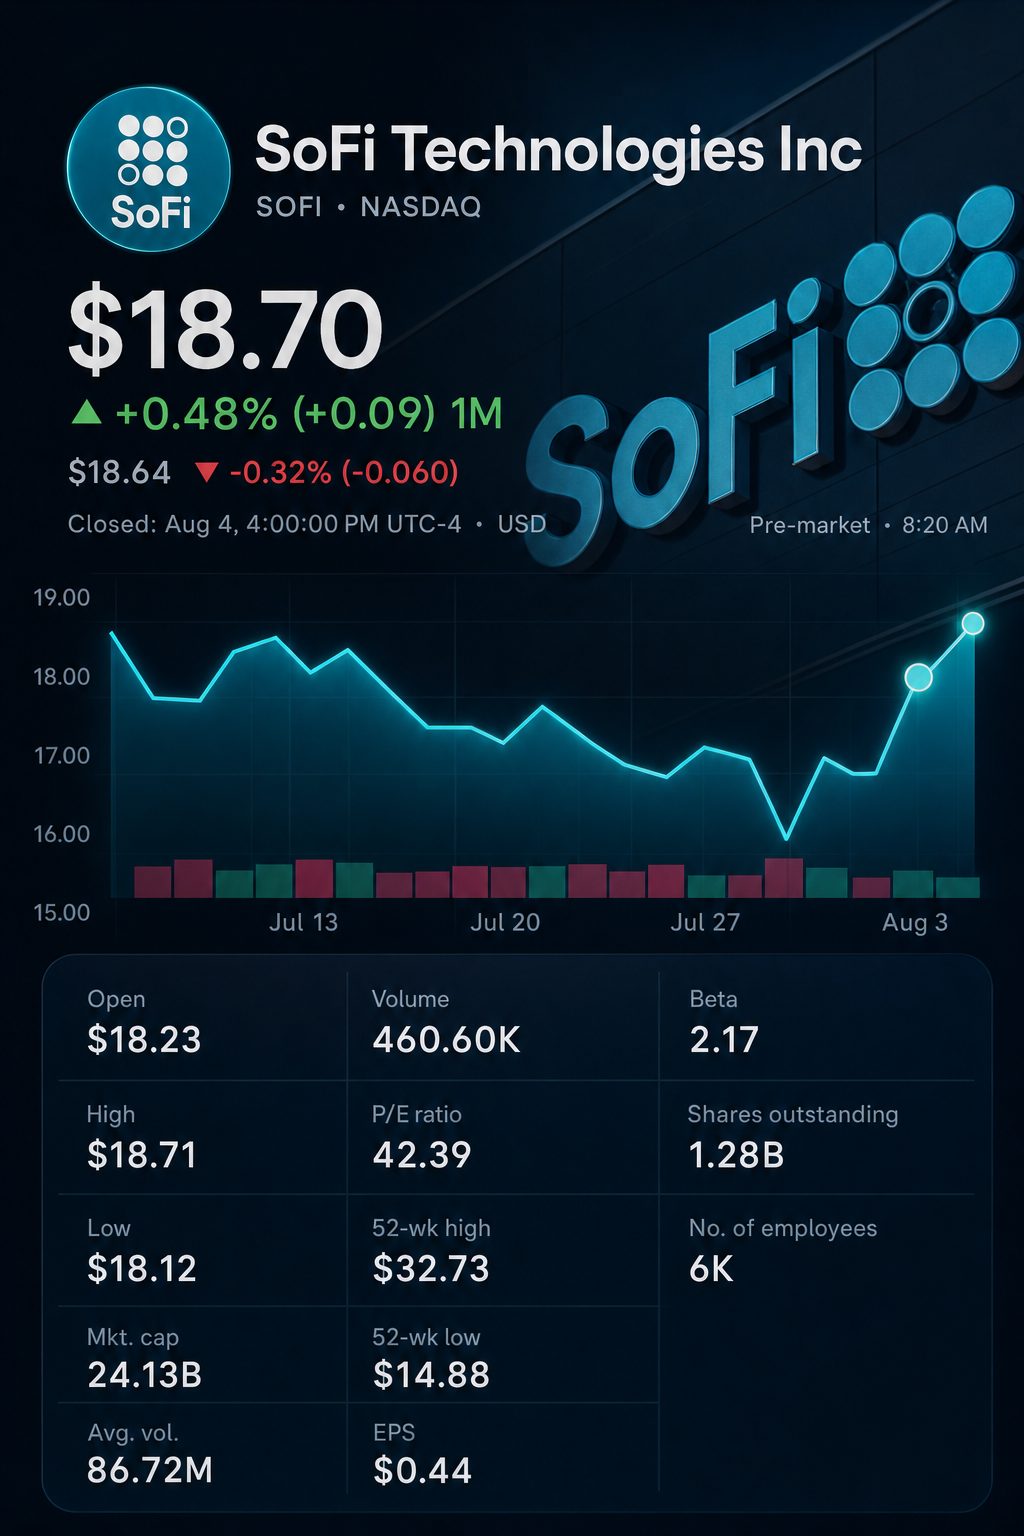
SoFi shares finished Tuesday at $18.70, rising 3.7%. Ahead of Wednesday’s market open, the stock changed hands at $18.67. The price is 22.6% higher than where it closed on July 29.
The price movement illustrates how rapidly investors changed their initial assessment.
| Session | Price | Session move | Versus July 28 |
|---|---|---|---|
| July 28, pre-results close | $16.74 | n/a | Baseline |
| July 29, results-day close | $15.25 | -8.9% | -8.9% |
| August 3 close | $18.03 | +10.5% | +7.7% |
| August 4 close | $18.70 | +3.7% | +11.7% |
| August 5 premarket, 07:59 EDT | $18.67 | -0.2% | +11.5% |
Figures are sourced from WSJ. Percentage shifts are based on the listed closing prices.
The increase on Tuesday was about twice the S&P 500’s 1.8% advance. Trading volume remained under SoFi’s 65-day average.
Adjusted earnings per share for the second quarter surpassed consensus by a cent. Reported revenue exceeded forecasts by 7.5%. The company increased its adjusted revenue outlook to $4.75-$4.85 billion from $4.655 billion, while keeping its primary profit goals unchanged.
The second-half bridge produced is not even.
| Adjusted measure | H1 2026 actual | Full-year guide | H2 required | Average H2 quarter versus Q2 |
|---|---|---|---|---|
| Net revenue | $2.293 billion | $4.75-$4.85 billion | $2.507 billion | +4.0% |
| EBITDA | $697.7 million | About $1.60 billion | $902.3 million | +26.1% |
| Net income | $327.1 million | About $825 million | $497.9 million | +55.2% |
| Diluted EPS | $0.24 | About $0.60 | About $0.36 | About +50% |
Early estimates are based on the midpoint revenue of $4.80 billion. The EPS bridge is an approximation due to the potential fluctuation of diluted share numbers. Every figure shown is non-GAAP.
Implied EBITDA margin for the second half stands at 36.0% at the midpoint. The company’s sales outlook implies a range of 35.3% to 36.7%. For the second quarter, the margin came in at 29.7%. SoFi must achieve an increase of 5.6 to 7.0 percentage points.
Anthony Noto, Chief Executive, told Reuters, “Spending remains strong, demand remains strong.” The share of new products opened by existing members rose to 51%, up from 43% in the previous quarter. The average number of products per member climbed to 1.54 from 1.51. Reuters
Sequential figures indicate ongoing growth along with pressure on margins.
| Operating measure | Q1 2026 | Q2 2026 | Sequential change |
|---|---|---|---|
| Cross-buy | 43% | 51% | up 8 percentage points |
| Products per member | 1.51 | 1.54 | increase of 0.03 |
| Fee-based revenue | $386.8 million | $472.3 million | rising 22.1% |
| Deposits | $40.2 billion | $45.5 billion | up 13.2% |
| Total loan originations | $12.18 billion | $14.80 billion | up 21.5% |
| Technology Platform revenue | $75.1 million | $84.5 million | rising 12.5% |
| Adjusted EBITDA margin, calculated | 31.3% | 29.7% | down 1.6 percentage points |
SoFi’s SEC release provides Q1 data. SEC Q2 data comes from the company’s most recent update.
Fee revenue, deposits, and originations each saw rapid growth. However, the adjusted EBITDA margin declined by 1.6 points. Technology Platform revenue was up compared to Q1, yet stayed 23% below the previous year.
Analysts have differing perspectives on the nature of that growth. KBW’s Tim Switzer described the second quarter as a “lower-quality beat” due to balance-sheet growth. Meanwhile, William Blair’s Andrew Jeffrey kept his outperform rating and recommended taking advantage of the dip. MarketWatch
Within the present Google Finance group, there are four buy ratings, seven holds and three sells. The average price target of $19.27 is just 3.1% higher than the closing price on Tuesday.
SoFi is priced at $18.70, reflecting 31.2 times the company’s adjusted earnings per share forecast. This initial multiple is based on non-GAAP results and does not represent a GAAP P/E ratio.
Risks: Expanding balance-sheet lending raises both capital utilization and exposure to consumer credit. Higher funding expenses and regulatory factors might postpone the anticipated improvement in margins. Technology Platform revenue is still significantly lower than it was a year ago.
The third-quarter EBITDA figures now serve as the most definitive measure. If the margin reaches 29.7% again, an even larger portion of the annual target would fall to the fourth quarter.
Related articles: NASDAQ:SOFI