NEW YORK, July 30, 2026, 12:11 p.m. EDT — U.S. cash equities start trading.
- SMH last changed hands at $537.18, remaining 1.1% under the $543 bearish neckline.
- SOXX rose 8.4%, beating SMH by 1.9 percentage points.
- Nvidia NASDAQ:NVDA accounted for 21.7% of SMH, contributing about 0.35 percentage point.
SMH saw a strong recovery on Thursday. The price stood at $537.18 as of 11:56 a.m. EDT after hitting a session high of $544.41 earlier. The most recent price remained under the $543 chart trigger highlighted by Yahoo Finance.
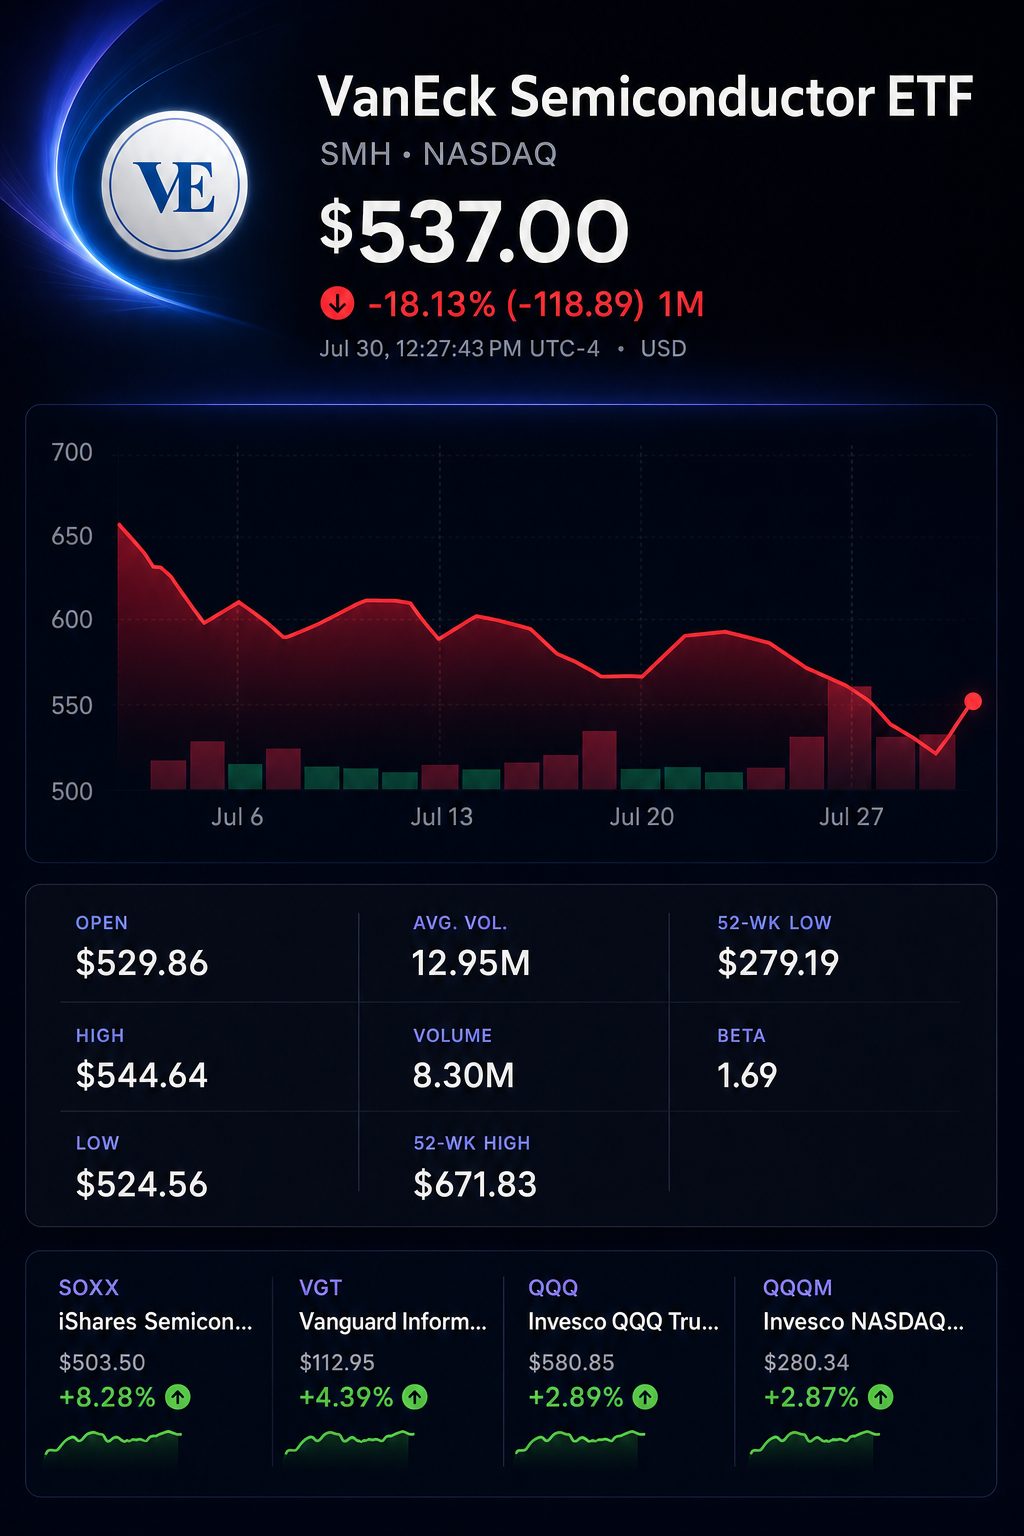
The main indication was seen in relative returns, with SOXX advancing 8.4% compared to a 6.5% gain in SMH. The difference of 1.9 points can be attributed to fund weightings.
ETF comparison at midday
| Fund | Latest price | Day change | Intraday low–high | Rebound from low |
|---|---|---|---|---|
| SMH | $537.18 | +6.54% | $502.50–$544.41 | +6.90% |
| SOXX | $504.04 | +8.40% | $462.04–$509.85 | +9.09% |
The most recent trades showed timestamps close to 11:56 a.m. EDT. The percentages reflect the listed prices.
Both funds rebounded significantly from their session lows. SOXX climbed 9.1%, while SMH rose 6.9%. However, neither managed to maintain its entire intraday advance.
SMH has a higher concentration, with Nvidia making up 21.7% of its assets. In comparison, SOXX gives Nvidia just 8.75%. The top 10 holdings in SMH collectively comprise 71.47% of the fund.
Portfolio focus
| Measure | SMH | SOXX |
|---|---|---|
| Total holdings | 26 | 30 |
| Nvidia allocation | 21.70% | 8.75% |
| Advanced Micro Devices NASDAQ:AMD allocation | 5.43% | 8.26% |
| Micron Technology NASDAQ:MU allocation | 4.74% | 7.93% |
| Top five holdings | 48.50% | 38.05% |
| Top ten holdings | 71.47% | 60.65% |
SMH weightings reflect data from July 29. SOXX weightings are based on July 28, while the number of its holdings is as of July 29. Official holdings form the basis of the concentration figures.
The weighting was significant on Thursday. Micron and AMD had larger roles in SOXX, jointly contributing roughly 2.30 points. In SMH, their combined impact was estimated at 1.44 points.
Initial estimate of contribution
| Holding | Share move | SMH weight / contribution | SOXX weight / contribution |
|---|---|---|---|
| Lam Research NASDAQ:LRCX | up 18.83% | 4.04% / rise of 0.76 point | 3.97% / rise of 0.75 point |
| Micron | up 15.66% | 4.74% / up 0.74 point | 7.93% / up 1.24 points |
| AMD | up 12.76% | 5.43% / up 0.69 point | 8.26% / higher by 1.05 points |
| Taiwan Semiconductor Manufacturing NYSE:TSM | up 7.21% | 9.51% / up 0.69 point | 4.57% / up 0.33 point |
| Nvidia | up 1.62% | 21.70% / up 0.35 point | 8.75% / up 0.14 point |
| Qualcomm NASDAQ:QCOM | down 2.42% | 4.11% / down 0.10 point | 3.04% / down 0.07 point |
Initial calculations are based on multiplying each fund’s stated weight by Thursday’s change in share price. These figures do not account for weight drift, cash positions, or potential tracking discrepancies.
Lam delivered the most straightforward earnings trigger. Revenue for the June quarter increased 15.1% from the previous period, reaching $6.72 billion. CEO Tim Archer stated Lam achieved “record revenue, operating margin and earnings per share.” For the September quarter, Lam projected revenue of $8.10 billion, above analysts’ forecast of $7.09 billion. Lam Research Newsroom
Cash generation remained a key market driver. Microsoft NASDAQ:MSFT gained 15.1% following robust sales results and positive cloud outlooks. Meta Platforms NASDAQ:META slid 8.7% as its second-quarter free cash flow plunged 91%. Investors showed selectivity among AI-heavy spenders.
Anna Rathbun, the founder of Grenadilla Advisory, stated that the issue is “no longer just how much these companies are spending.” According to her, higher rates may not limit budgets. Companies regard AI as essential for competition. Reuters
Qualcomm’s shares dropped 2.4% by late morning. The company projected adjusted quarterly earnings between $2.05 and $2.25, while analysts had anticipated $2.36. Higher memory and packaging costs weighed further. Revenue from Apple NASDAQ:AAPL modems was expected to fall at a quicker pace.
The rebound came after significant losses. The Philadelphia semiconductor index dropped almost 30% from its June 22 high by Wednesday. Forced position reductions that began in Asian chip markets also impacted U.S. equities.
The technical outlook is still uncertain. Michael Kramer’s analysis at Seeking Alpha highlighted $510–$520 as a key support area. SMH touched a low of $502.50, falling below this range before recovering. Kramer also pointed to negative gamma, which can cause dealer hedging to amplify price movement.
Technical and historical benchmarks
| Measure | Published reference | Latest reading or historical result |
|---|---|---|
| Yahoo Finance bearish neckline | $543 | $537.18; session high stood at $544.41 |
| Seeking Alpha support zone | $510–$520 | Touched low at $502.50; latest level moved back above zone |
| Trefis sample of 10%-plus declines | 15 periods since 2005 | 13 resulted in positive returns over following year |
| Trefis median path | +21% after one year | Further drawdown of 12% seen in interim |
History provides evidence, but not reassurance. Trefis identified one-year gains following 13 out of 15 significant declines, representing an 86.7% success rate based on past data. However, the average investor typically faced a further 12% decline before seeing returns.
Thursday’s figures support a broader semiconductor rally rather than a rebound led by individual stocks. With Nvidia holding a reduced weighting in SOXX, Micron and AMD had greater impact. For SMH, broader participation and a lasting move above $543 remain necessary.
Risks: A sustained close under $510 would strengthen bearish momentum. If the price holds above $543, it would counter that scenario. Elevated interest rates, tighter export restrictions, and reduced customer demand may outweigh technical signals.
Related articles: NASDAQ:NVDA