
NEW YORK, July 30, 2026, 11:04 EDT — U.S. cash equities trading begins.
- Vanguard S&P 500 ETF NYSEARCA:VOO rose 1.04% to $677.60, recovering from a 1.52% decline on Wednesday.
- Initial attribution indicates that eight semiconductor stocks accounted for approximately 64 basis points of Wednesday’s intraday drop, while Caterpillar was responsible for about five basis points.
- Vanguard Total Stock Market ETF NYSEARCA:VTI holds almost seven times as many stocks as VOO. The concentration in its top ten holdings is just 4.5 percentage points less.
Vanguard S&P 500 ETF rose over 1% early Thursday. Despite the recovery, the main takeaway from Wednesday stands. The decline was largely due to heavy semiconductor weighting, rather than moves in Caterpillar Inc. NYSE:CAT.
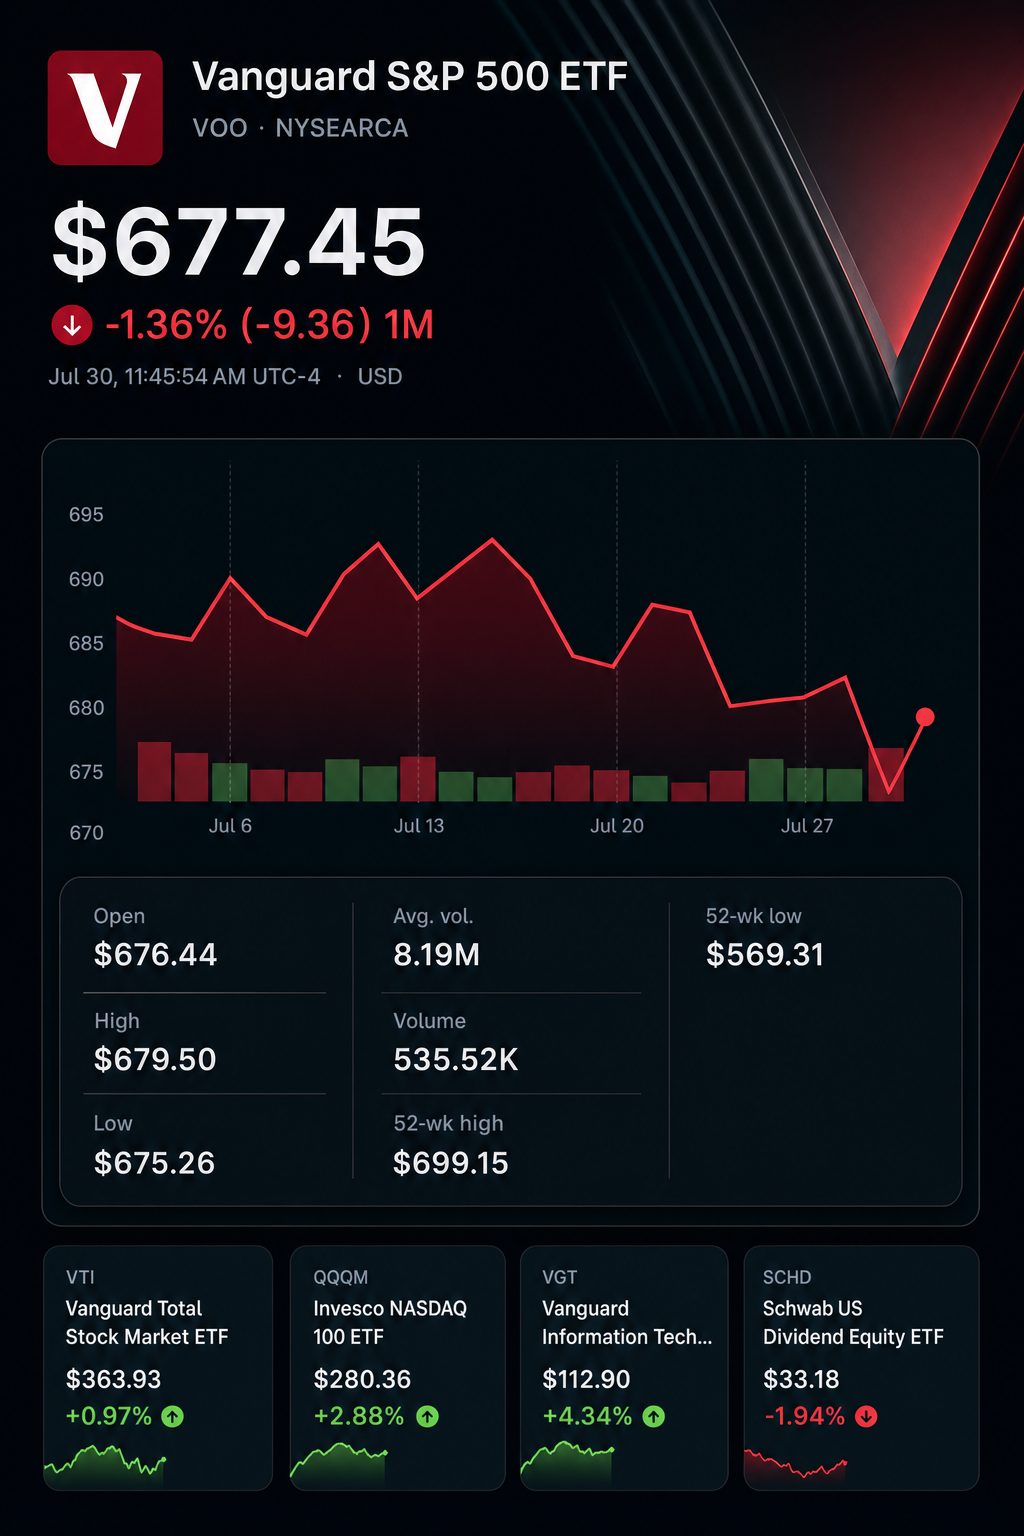
At 12:15 p.m. EDT, Quiver reported VOO down 0.9%. Its internal holdings suggested a different picture. Eight semiconductor stocks together accounted for an estimated 64.3 basis points of negative impact. Caterpillar represented a further 5.2 basis points of drag.
The difference is significant for index investors. Vanguard Total Stock Market ETF includes almost seven times as many stocks. However, its top ten positions still account for a third of overall assets.
Gains on Thursday were similarly focused. Shares of Microsoft Corp. NASDAQ:MSFT jumped 15.4% following an improved revenue and cloud forecast. Nvidia Corp. NASDAQ:NVDA gained 2.8%. Meta Platforms Inc. NASDAQ:META dropped 9.2% as its quarterly free cash flow fell 91%.
Intraday snapshot, around 10:49 a.m. EDT
| Security | Price | Change | Exposure |
|---|---|---|---|
| Vanguard S&P 500 ETF NYSEARCA:VOO | $677.60 | +1.04% | S&P 500 |
| Vanguard Total Stock Market ETF NYSEARCA:VTI | $363.91 | +0.97% | Total U.S. market |
| SPDR S&P 500 ETF Trust NYSEARCA:SPY | $737.29 | +1.07% | S&P 500 |
| iShares Core S&P 500 ETF NYSEARCA:IVV | $740.62 | +1.02% | S&P 500 |
| Caterpillar Inc. NYSE:CAT | $810.79 | +3.59% | Industrial stock |
Alterations are measured from the prior session’s close.
All four major ETFs gained by up to 0.10 percentage point. VTI’s slightly higher allocation to mid- and small-cap stocks had little effect. Megacap stocks continued to lead performance.
The following table offers an early estimate. It calculates by multiplying Quiver’s cited fund weight with each share movement. Real attribution could differ based on float weights and the timing of trades during the day.
Initial source identification for Quiver’s VOO snapshot
| Driver | VOO weight | Stock move | Estimated VOO drag |
|---|---|---|---|
| Nvidia Corp. NASDAQ:NVDA | 7.5% | -2.6% | -19.5 bp |
| Micron Technology Inc. NASDAQ:MU | 2.0% | -5.6% | -11.2 bp |
| Advanced Micro Devices Inc. NASDAQ:AMD | 1.5% | -5.7% | -8.6 bp |
| Broadcom Inc. NASDAQ:AVGO | 2.8% | -2.3% | -6.4 bp |
| Applied Materials Inc. NASDAQ:AMAT | 0.9% | -6.2% | -5.6 bp |
| KLA Corp. NASDAQ:KLAC | 0.6% | -8.5% | -5.1 bp |
| Lam Research Corp. NASDAQ:LRCX | 0.8% | -5.2% | -4.2 bp |
| Intel Corp. NASDAQ:INTC | 1.0% | -3.8% | -3.8 bp |
| Eight-chip subtotal | 17.1% | — | -64.3 bp |
| Caterpillar Inc. NYSE:CAT | 0.8% | -6.5% | -5.2 bp |
| Amazon.com Inc. NASDAQ:AMZN | 3.6% | -1.3% | -4.7 bp |
| Ten-name total | 21.5% | — | -74.2 bp |
A basis point is 0.01 percentage point. Totals might not add up due to rounding.
Approximately 71% of Quiver’s 90-basis-point drop is attributed to chip stocks, while Caterpillar accounts for around 6%. The headline mixed up a major move in an individual stock with a significant impact on the fund.
Caterpillar had a much larger impact on the price-weighted Dow. Its $57.63 drop translated to around 342 points in the index, accounting for nearly 30% of Wednesday’s 1,153-point slide.
Baird’s Mig Dobre downgraded Caterpillar from Buy to Hold, lowering the price target to $900 from $1,200. The analyst pointed to increased regulations and growing local pushback affecting data-center initiatives.
The fund comparison offers limited reassurance. VTI introduces 3,025 additional stocks, yet top-ten concentration declines by just 4.5 percentage points.
Fund composition as of June 30, 2026
| Metric | VOO | VTI |
|---|---|---|
| Total stocks | 506 | 3,531 |
| Top ten holdings as percentage | 37.9% | 33.4% |
| Nvidia allocation | 7.5% | 6.4% |
| Market cap, median | $455.6 billion | $336.5 billion |
| P/E ratio | 27.5 times | 27.0 times |
| Three-year volatility | 13.06% | 13.45% |
| Annualized return, 10-year | 15.47% | 15.03% |
| Expense fee | 0.03% | 0.03% |
Past returns are not indicative of future results.
This represents just a 12% relative decrease in top-ten exposure. Over three years, VTI’s volatility was marginally greater, not less. Breadth measured by company number differs from breadth by capital.
The $500-per-month scenario cited uses a 9% yearly return rate. The final value of $508,205 aligns with making a single $6,000 deposit each year at year-end. Estimation example: contributing monthly at the same annualized return grows to $528,843. The added value of early investing amounts to roughly $20,600 before taxes.
The referenced 9,000 projection does not represent a new base expectation. In October 2025, Evercore Inc. NYSE:EVR strategist Julian Emanuel maintained a central target of 7,750. He gave a 30% probability to a scenario in which the index reaches 9,000. Based on Wednesday’s close, these targets indicate potential gains of 5.9% and 23.0%.
Anna Rathbun, who founded Grenadilla Advisory, described the live risk in another way. “The concern is no longer just how much these companies are spending,” she said. Rising rates might not stop the AI expansion. Reuters
Risks: Solid earnings may continue to drive gains for both funds, even with heavy concentration. However, increased long-term yields, limited AI cash flow, or stricter data-center regulations could cause that trend to reverse. VTI would provide limited protection from megacap exposure.
Related articles: NASDAQ:META