NEW YORK, July 30, 2026, 15:04 EDT — U.S. markets are open.
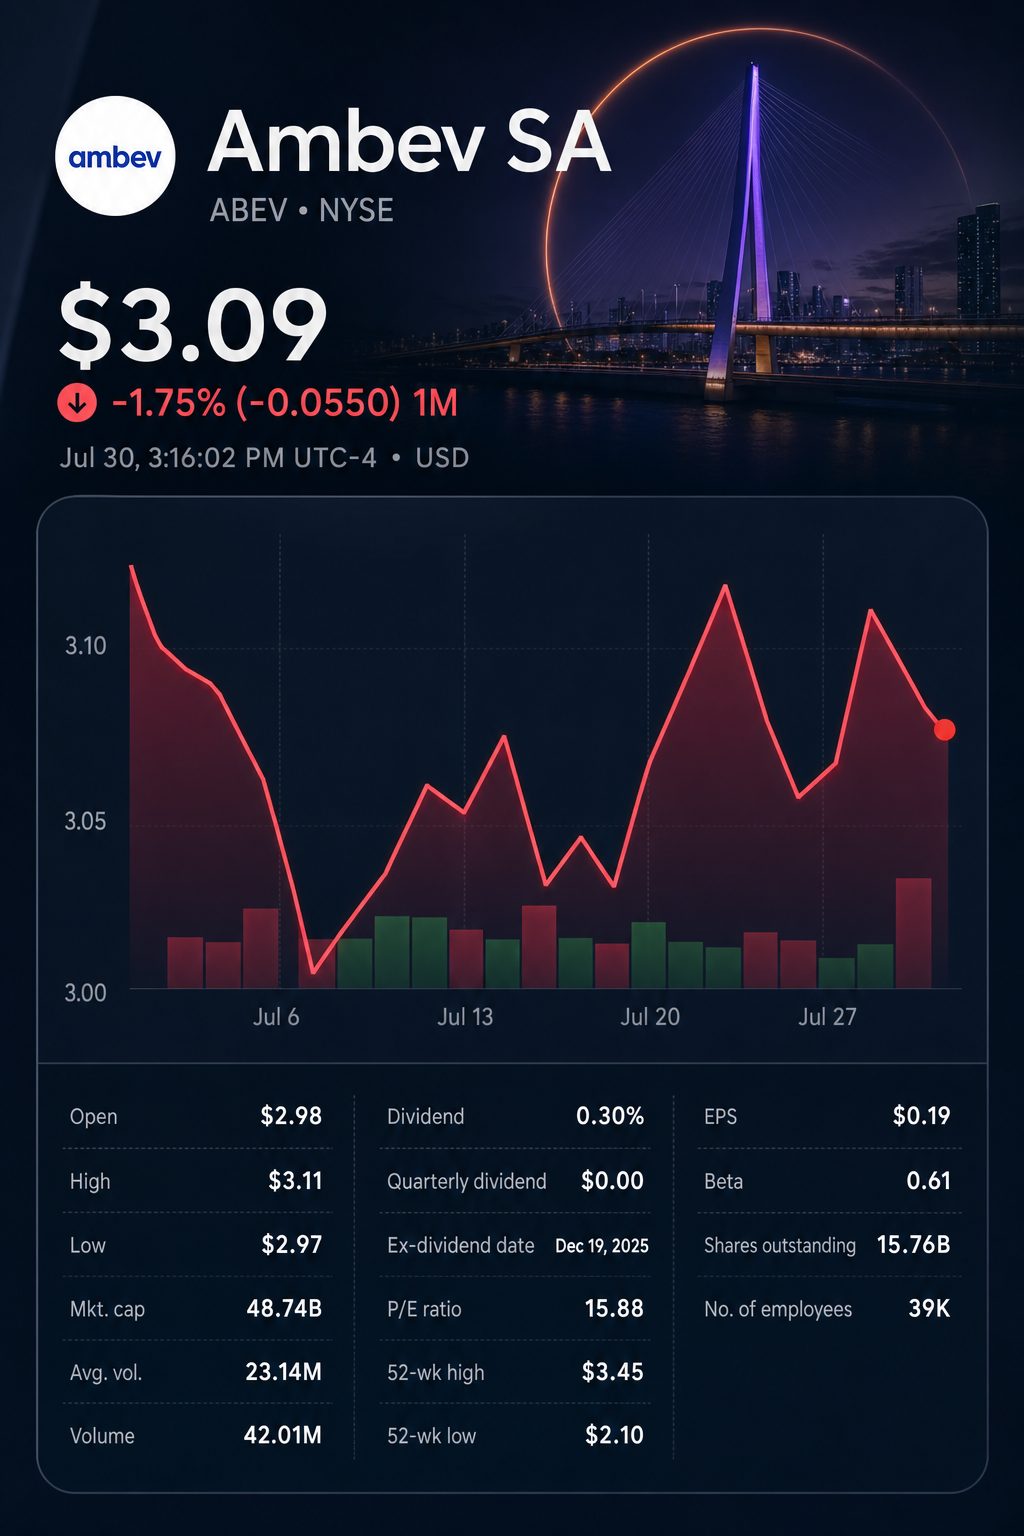
- Ambev ADRs were last at $3.09, slipping 0.5%, after reaching a session low of $2.93. Intraday figures are preliminary.
- Normalized profit climbed 23.3%, and organic EBITDA was up 8.9%.
- A reporter calculation showed that working-capital improvement accounted for 79% of the rise in operating cash flow.
Ambev S.A. (NYSE:ABEV; BVMF:ABEV3) recovered from most of a 5.5% intraday drop on Thursday. U.S.-listed shares slipped 0.5% to $3.09 as revenue and EBITDA came in below XP estimates, though profit exceeded them.
The surge in cash flow drew the most attention. However, a Reuters analysis indicates that 79% of the R$1.66 billion rise came from working capital. That sets a higher hurdle for similar results ahead.
The stock rebounded over 5% from its intraday low.
| U.S. ADR metric | Preliminary reading |
|---|---|
| Most recent price | $3.085 |
| Change on the day | -0.5% |
| Start price | $2.98 |
| Gap at open | -3.9% |
| Low during session | $2.93 |
| Decline at session low | -5.5% |
| Bounce from session low | +5.3% |
| Trading volume | 39.5 million |
The prior closing price stood at $3.10. Delayed intraday data were captured at 14:49 EDT; market figures remain preliminary.
Ambev posted a normalized profit of R$3.49 billion, marking a 23.3% increase. Organic revenue climbed 6.1%, and organic normalized EBITDA advanced 8.9%.
CEO Carlos Lisboa stated, “The consistent execution of our growth strategy translated into another quarter of beer volume growth, with solid top and bottom-line performance.”
The quarter saw moderate reported sales growth, accompanied by more robust underlying operations.
| Metric | 2Q25 | 2Q26 | Reported change | Organic change |
|---|---|---|---|---|
| Volume | 39.57m hl | 39.73m hl | up 0.4% | up 1.4% |
| Net revenue | R$20.09bn | R$20.15bn | up 0.3% | up 6.1% |
| Normalized EBITDA | R$6.15bn | R$6.38bn | up 3.6% | up 8.9% |
| EBITDA margin | 30.6% | 31.6% | rises 100 bps | rises 80 bps |
| Normalized profit | R$2.83bn | R$3.49bn | up 23.3% | — |
| Operating cash flow | R$3.05bn | R$4.71bn | up 54.5% | — |
Organic results reflect adjustments for currency movements, scope changes and other reporting factors, such as hyperinflation accounting in Argentina.
Much of the organic growth was counterbalanced by currency translation and scope changes, resulting in reported revenue rising just 0.3% and EBITDA increasing 3.6%.
XP Inc. NASDAQ:XP analysts Leonardo Alencar and Leonardo Paiva reported that revenue came in 4.5% below their forecast. EBITDA was 3.3% lower than expected, but net profit surpassed their estimate by 15.5%.
According to Money Times, Citigroup NYSE:C reported revenue that fell short of consensus estimates by 3%, while profit surpassed consensus forecasts by roughly 15%. Analysts from both firms had set market expectations for Brazil Beer volume growth at nearly 7%, but the actual result was 5%.
The cash-flow statement clarifies why the headline rise should be interpreted with caution.
| Cash-conversion measure | 2Q25 | 2Q26 | Change |
|---|---|---|---|
| Cash flow prior to working capital | R$6.21bn | R$6.29bn | +1.3% |
| Working capital impact | R$2.27bn | R$0.95bn | R$1.32bn less |
| Operating cash flow | R$3.05bn | R$4.71bn | +54.5% |
| OCF/normalized EBITDA | 49.6% | 73.9% | +24.3 points |
| Basic free-cash-flow estimate | R$1.96bn | R$3.83bn | +95.3% |
Reuters analysis is based on data provided by the company. The free-cash-flow proxy is derived by subtracting spending on property, plant, equipment and intangible assets from operating cash flow. This metric is not reported by the company.
Payables accounted for the majority of working-capital gains, with cash outflows reduced by R$1.51 billion. Meanwhile, inventory changed from contributing R$457 million in cash to consuming R$220 million.
Cash flow prior to working-capital changes increased by just R$80 million. Reduced capital expenditures also provided additional support to the free-cash-flow metric.
Brazil Beer continued to serve as the main operating anchor, with volume up 5.0%, revenue ahead by 8.9% and normalized EBITDA rising 12.8%.
Premium volumes increased by around 25%. No-alcohol beer saw growth of approximately 30%, and the balanced-choices portfolio experienced a twofold rise.
Results were more mixed beyond the main beer business.
| Business unit | Volume | Revenue | Normalized EBITDA | EBITDA margin |
|---|---|---|---|---|
| Brazil Beer | rose 5.0% | increased 8.9% | improved 12.8% | up 110 bps |
| Brazil non-alcoholic drinks | dropped 4.4% | up 1.4% | advanced 13.8% | gained 320 bps |
| Central America and Caribbean | expanded 5.4% | grew 7.1% | climbed 4.9% | fell 90 bps |
| Latin America South | fell 2.9% | edged up 4.4% | up 2.6% | down 30 bps |
| Canada | decreased 1.8% | rose 2.1% | up 2.9% | added 30 bps |
Data reflect organic changes compared to the same period last year.
Brazil’s non-alcoholic beverages arm saw a decline in volume, but achieved a 13.8% increase in EBITDA. Reduced costs for sugar and packaging drove a 320-basis-point improvement to its margin. Margins contracted in CAC and Latin America South.
Digital platforms were another area of expansion. BEES marketplace saw a 58% increase in gross merchandise value, and Zé Delivery’s GMV grew by 16%. Premium brands accounted for roughly 35% of Zé Delivery’s volume.
Ambev’s improved cash flow bolsters its capital return plans. The brewer reported returning approximately R$5.9 billion so far this year and completing nearly 95% of its share buyback set for October 2025.
The board has also authorized R$1.1 billion in additional interest on capital. Another R$1.9 billion installment is set for October 6.
The company maintained its full-year outlook, projecting a 4.5% to 7.5% rise in Brazil Beer cash cost per hectoliter, excluding third-party marketplace products. In the second quarter, the increase was 4.5%.
Risks: The benefit from improved working capital could fade if payables return to typical levels. Cash selling and administrative expenses climbed 10.7%, as volumes fell across three business units. Reported comparisons may also be affected by fluctuations in currency, weather changes and inflation in Argentina.