NEW YORK, August 4, 2026, 06:05 EDT
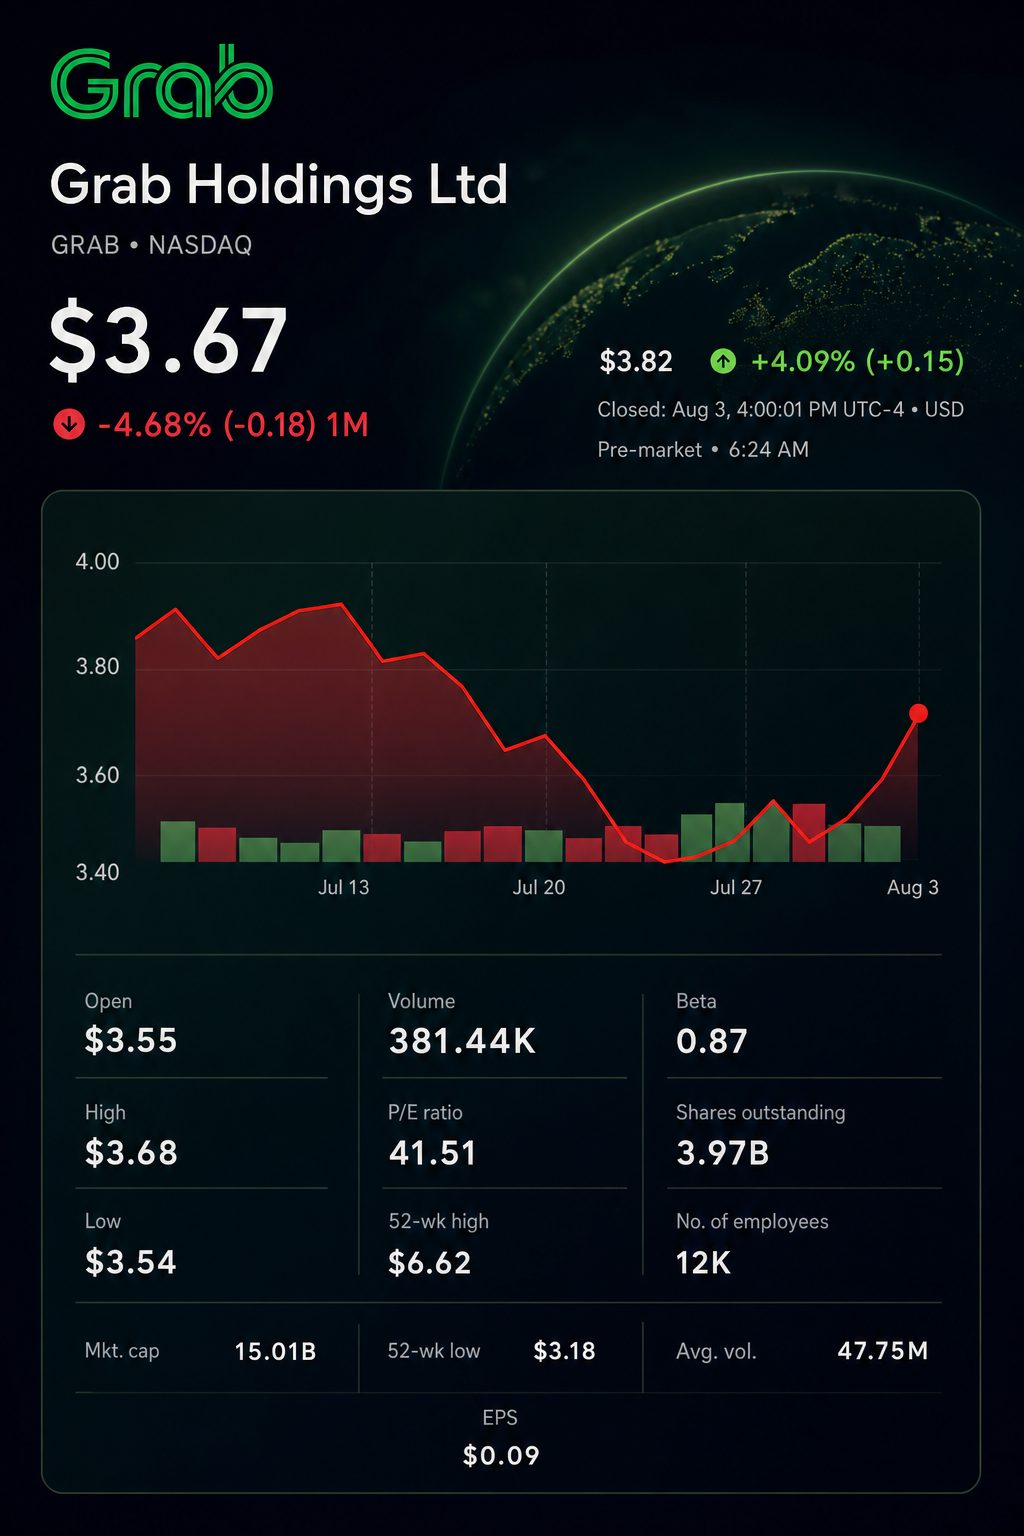
- Grab was last seen trading around $3.82 in premarket action, up 4.1% from the previous session’s close on Monday.
- Revenue increased by 22% to $997 million, while adjusted EBITDA surged 54%.
- Incremental adjusted EBITDA margin was 33%, even with increased spending on incentives.
Grab Holdings Limited NASDAQ:GRAB changed hands at around $3.82 ahead of Tuesday’s market open, up 4.1% from Monday’s closing price of $3.67. Nasdaq was shut for its standard trading hours. Premarket activity continues until 9:30 a.m. EDT.
The sales outperformance was modest, as revenue exceeded the LSEG projection of $990.8 million by roughly 0.6%. A more robust indicator appeared in adjusted EBITDA, which came in at $168 million.
Grab generated $59 million in adjusted EBITDA from $178 million in revenue, resulting in an incremental margin of 33%, according to company data. Incentives grew 29% to reach $706 million. The firm’s share of on-demand GMV climbed by 72 basis points to 10.9%.
Grab had surpassed the Nasdaq in the previous week. Monday’s surge widened the gap ahead of the earnings release.
| Market period | Grab | Nasdaq Composite |
|---|---|---|
| Week ended July 31 | +5.7% | +1.6% |
| August 3 regular session | +4.9% | +2.1% |
| August 4 premarket | +4.1% around $3.82 | Regular session closed |
The unaudited scorecard indicates expansion in growth and margins, alongside lower cash conversion for the quarter. Non-IFRS adjustments are applied to the figures.
| Q2 measure | 2026 | 2025 | Change |
|---|---|---|---|
| On-demand GMV | $6.463 billion | $5.354 billion | +21% |
| Revenue | $997 million | $819 million | +22% |
| Monthly transacting users | 53.9 million | 46.2 million | +17% |
| Adjusted EBITDA | $168 million | $109 million | +54% |
| Adjusted EBITDA margin | 16.9% | 13.3% | +3.6 points |
| Adjusted free cash flow | $73 million | $112 million | -35% |
Headline profit requires attention. The $235 million figure factors in a one-off $307 million Superbank gain. A tax benefit of $66 million also contributed. These were countered by a $183 million fair-value loss. Operating profit stood at $19 million.
Segment results reveal the source of the margin. Most of the additional revenue was driven by deliveries.
| Segment | Q2 revenue | Revenue growth | Segment adjusted EBITDA | Margin or scale measure |
|---|---|---|---|---|
| Deliveries | $531 million | up 21% | $96 million | 2.3% of GMV, an increase of 45 basis points |
| Mobility | $331 million | up 12% | $191 million | 8.6% of GMV, a decrease of 9 basis points |
| Financial services | $134 million | up 59% | -$15 million | Loan portfolio expanded by 197% |
Deliveries contributed $92 million, accounting for 52% of the jump in Grab’s revenue. Adjusted EBITDA for the segment increased by $33 million. Advertising and greater operating efficiency raised the GMV margin by 45 basis points.
Mobility experienced a shift. Transactions climbed by 28%, with GMV up 18%. The segment margin dropped by nine basis points due to additional driver support. Peter Oey told Reuters, “We know our ASEAN customers are watching their wallet.”
Financial services saw the strongest growth, with revenue up 59% and the loan portfolio reaching $2.3 billion, a threefold increase. Without Superbank, the portfolio doubled to $1.6 billion. Grab reported that non-performing-loan ratios remained unchanged. However, provisions for credit losses continued to impact operating profit.
Guidance saw a slight increase, while capital returns showed a more pronounced movement.
| Item | Previous | Updated | Change or scale |
|---|---|---|---|
| 2026 revenue forecast | $4.04–$4.10 billion | $4.10–$4.15 billion | Midpoint rises 1.4% |
| 2026 adjusted EBITDA outlook | $700–$720 million | $720–$740 million | Midpoint rises 2.8% |
| Share buyback plan | $500 million prior authorization | Extra $750 million | Represents roughly 5% of market capitalization |
The raised guidance accounts for consolidation effects from Superbank and Stash, so it does not represent an entirely organic revision. Stash’s performance will be included in the financial-services segment in the third quarter.
The latest approval represents about 5% of Grab’s market capitalization as of Monday. The company is not obligated to use the entire sum. As of July, Grab had executed $351 million through the previous buyback initiative.
Management linked some of the margin improvement to artificial intelligence. Oey stated, “The cost structure is getting better and better.” According to Grab, AI-related interaction costs have dropped by over half since June 2025. The company’s sales assistant tool now saves roughly 40,000 hours per quarter. Reuters
Two peer updates are scheduled for Wednesday. Uber Technologies NYSE:UBER will release results at 8:00 a.m. EDT, while DoorDash NASDAQ:DASH is set to report at 4:30 p.m. EDT. Industry comparisons could shift based on their comments regarding fuel, incentives and margins.
Risks: Adjusted free cash flow dropped 35% in the quarter. Mobility margin slimmed, and credit exposure increased significantly. Rising fuel expenses and Indonesia’s updated commission regulations could weigh on returns in the second half.
Related articles: NASDAQ:GRAB