
NEW YORK, August 12, 2026, 06:47 EDT
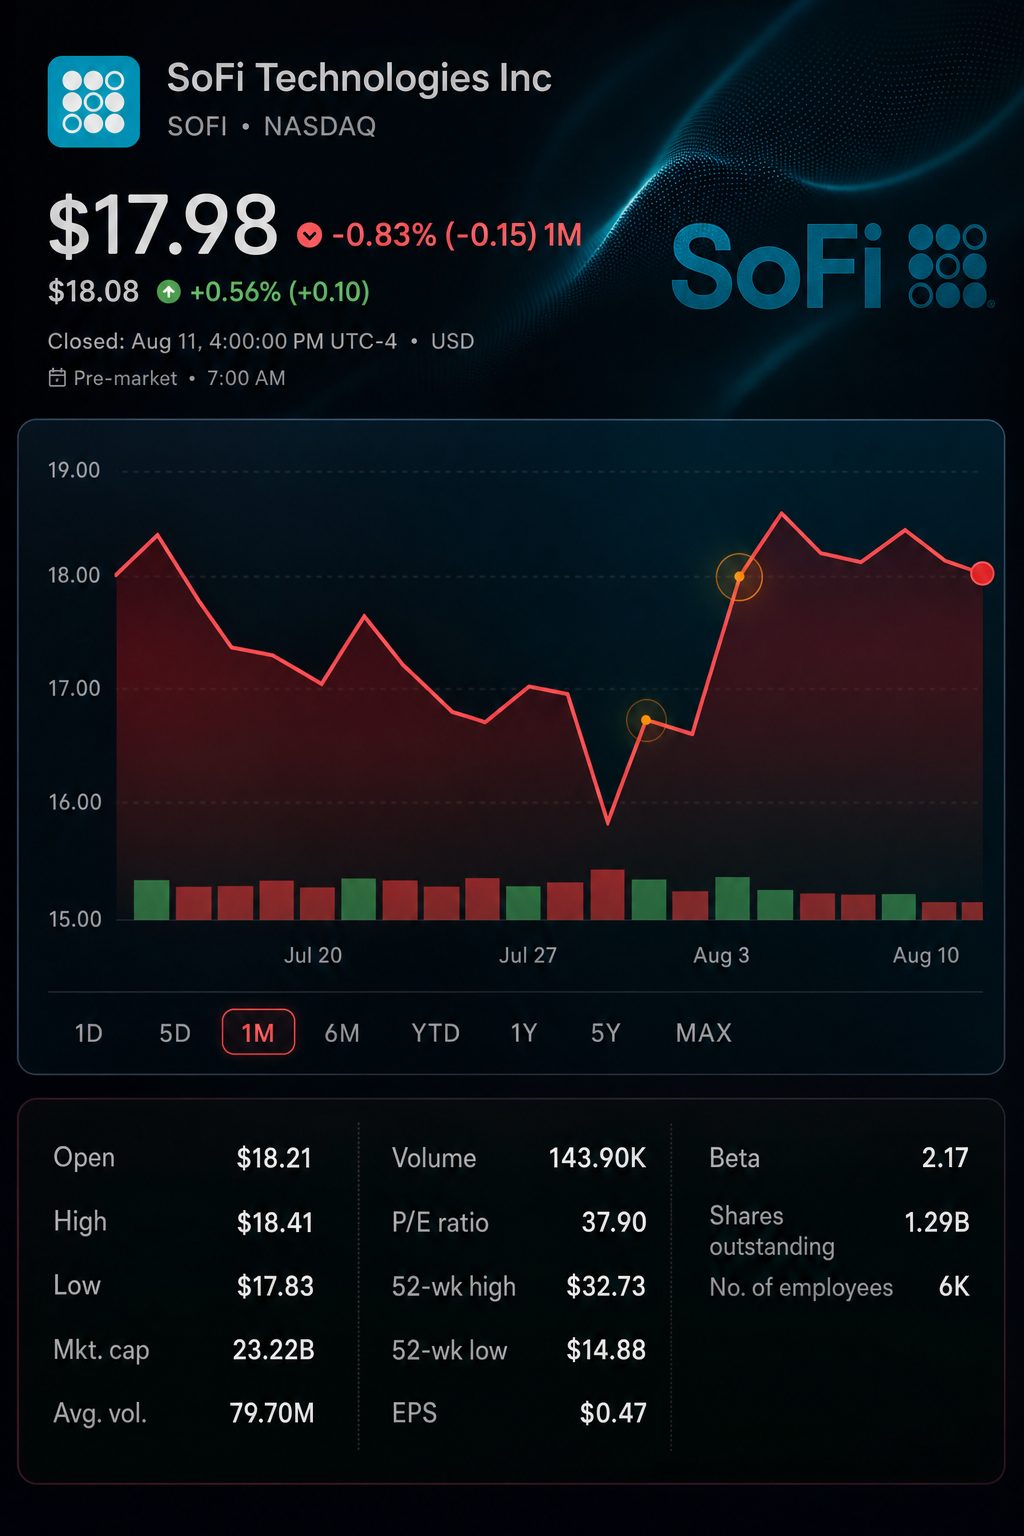
- SoFi ended Tuesday at $17.98 and was trading at $18.05 ahead of Wednesday’s market open.
- The share price reflects roughly 30 times the company’s projected adjusted EPS for 2026, according to management’s target.
- Analysts divided as 4 recommend Buy, 6 rate Hold and 3 suggest Sell, with an average target price of $19.27.
SoFi Technologies NASDAQ:SOFI traded close to $18 ahead of the Wednesday open. This valuation puts investors at roughly 30 times the company’s 2026 adjusted earnings goal, following a 40% rise in second-quarter adjusted revenue.
This is the compromise at present. SoFi is gaining members and products faster than ever, yet the consensus Wall Street price target suggests just a 7.2% increase from where shares closed on Tuesday.
The valuation remains high based on present earnings. However, it appears more reasonable when compared to the increased 2026 forecast, although that metric is non-GAAP.
| Valuation measure | Value | Investor read-through |
|---|---|---|
| August 11 close | $17.98 | Session ended down 0.77% |
| August 12 premarket | $18.05 | Premarket up 0.39% from last close |
| Trailing P/E | 37.9x | Reflects $0.47 trailing EPS |
| Price/tangible book value | 2.45x | Figure is based on $7.34 per share |
| Price/2026 adjusted EPS target | 30.0x | Derived from management’s projected $0.60 |
| Average analyst target | $19.27 | Represents 7.17% above latest close |
Closing price, premarket quote, trailing P/E, and analyst target were provided by Google Finance. The tangible-book and forward earnings ratios are based on SoFi’s reported tangible book value per share of $7.34 and its adjusted EPS forecast of $0.60.
The second quarter figures highlight the valuation. GAAP revenue increased 43% to $1.219 billion, with net income rising 61% to $156.6 million.
| Second-quarter measure | 2026 | 2025 | Change |
|---|---|---|---|
| GAAP net revenue | $1,218.7 million | $854.9 million | up 43% |
| Adjusted net revenue | $1,205.6 million | $858.2 million | up 40% |
| GAAP net income | $156.6 million | $97.3 million | up 61% |
| Diluted EPS | $0.12 | $0.08 | up 50% |
| Adjusted EBITDA | $357.8 million | $249.1 million | up 44% |
The table is based on SoFi’s July 29 earnings announcement, disclosed as an exhibit with the SEC. Adjusted EBITDA margin climbed to 30% for the quarter.
Chief Executive Anthony Noto stated in the release, “Despite continued market uncertainty, our business model continues to prove its durability.” The figures back up this statement, though the mix is still inconsistent. SoFi earnings release
Lending drove the majority of expansion. Technology Platform revenue declined 23% versus a year ago, despite a 13% increase compared to the previous quarter.
| Segment | Q2 2026 revenue | Year-on-year change | Contribution margin | Prior-year margin |
|---|---|---|---|---|
| Lending | $724.8 million | up 63% | 55% | 55% |
| Financial Services | $466.3 million | up 29% | 46% | 52% |
| Technology Platform | $84.5 million | down 23% | 14% | 30% |
SoFi’s segment data highlights the divergence. The Financial Services margin declined by six percentage points, whereas the Technology Platform margin dropped by over half.
The consumer segment continued to grow, with membership climbing 35% to 15.8 million and products rising 42% to 24.4 million. Current members accounted for 51% of newly opened products.
Funding conditions strengthened as well. Deposits made up more than 90% of average liabilities, and SoFi projected $712.6 million in annualized interest cost reductions compared to using warehouse funding. Fee-based revenue totaled $472.3 million, accounting for 39% of overall revenue.
Management increased its adjusted revenue outlook while maintaining primary profit targets. This shifts the pressure onto execution instead of another revision to estimates.
| 2026 outlook | Management target | Implied margin or growth |
|---|---|---|
| Adjusted net revenue | $4.75 billion-$4.85 billion | Increase of 32% to 35% |
| Adjusted EBITDA | Roughly $1.6 billion | Margin between 33% and 34% |
| Adjusted net income | Roughly $825 million | Margin near 17% |
| Adjusted EPS | Approximately $0.60 | Excludes GAAP |
| Member growth | Minimum 30% | Compared to previous year |
SoFi stated it is unable to provide a reconciliation of the forward non-GAAP metrics, citing uncertainty over certain GAAP items. This restricts direct comparability with the trailing P/E ratio.
Wall Street analysts are split. The majority recommend holding, with price targets ranging from $15 on the low end to $30 at the high end—a difference of twofold.
| Analyst view | Count | Share of 13 ratings | Reference target |
|---|---|---|---|
| Buy | 4 | 30.8% | Peak: $30.00 |
| Hold | 6 | 46.2% | Median: $19.27 |
| Sell | 3 | 23.1% | Lowest: $15.00 |
Over the last three months, the rating panel has included 13 analysts. Among recent calls are a Buy recommendation from Citi with a $30 target, a Sell call at $16 from KBW, and a Hold rating at $18 from Goldman Sachs.
Risks: Accelerated credit losses, a decline in loan demand, or less favorable deposit economics may impact earnings. Ongoing shrinkage in the Technology Platform would further undermine justification for a widespread fintech premium.
The next key decision is evident. SoFi needs to safeguard its lending credit and restore growth in its Technology Platform to support a valuation of about 30 times targeted adjusted earnings.
Related articles: NASDAQ:SOFI