
NEW YORK, August 30, 2026, 15:20 (ET)
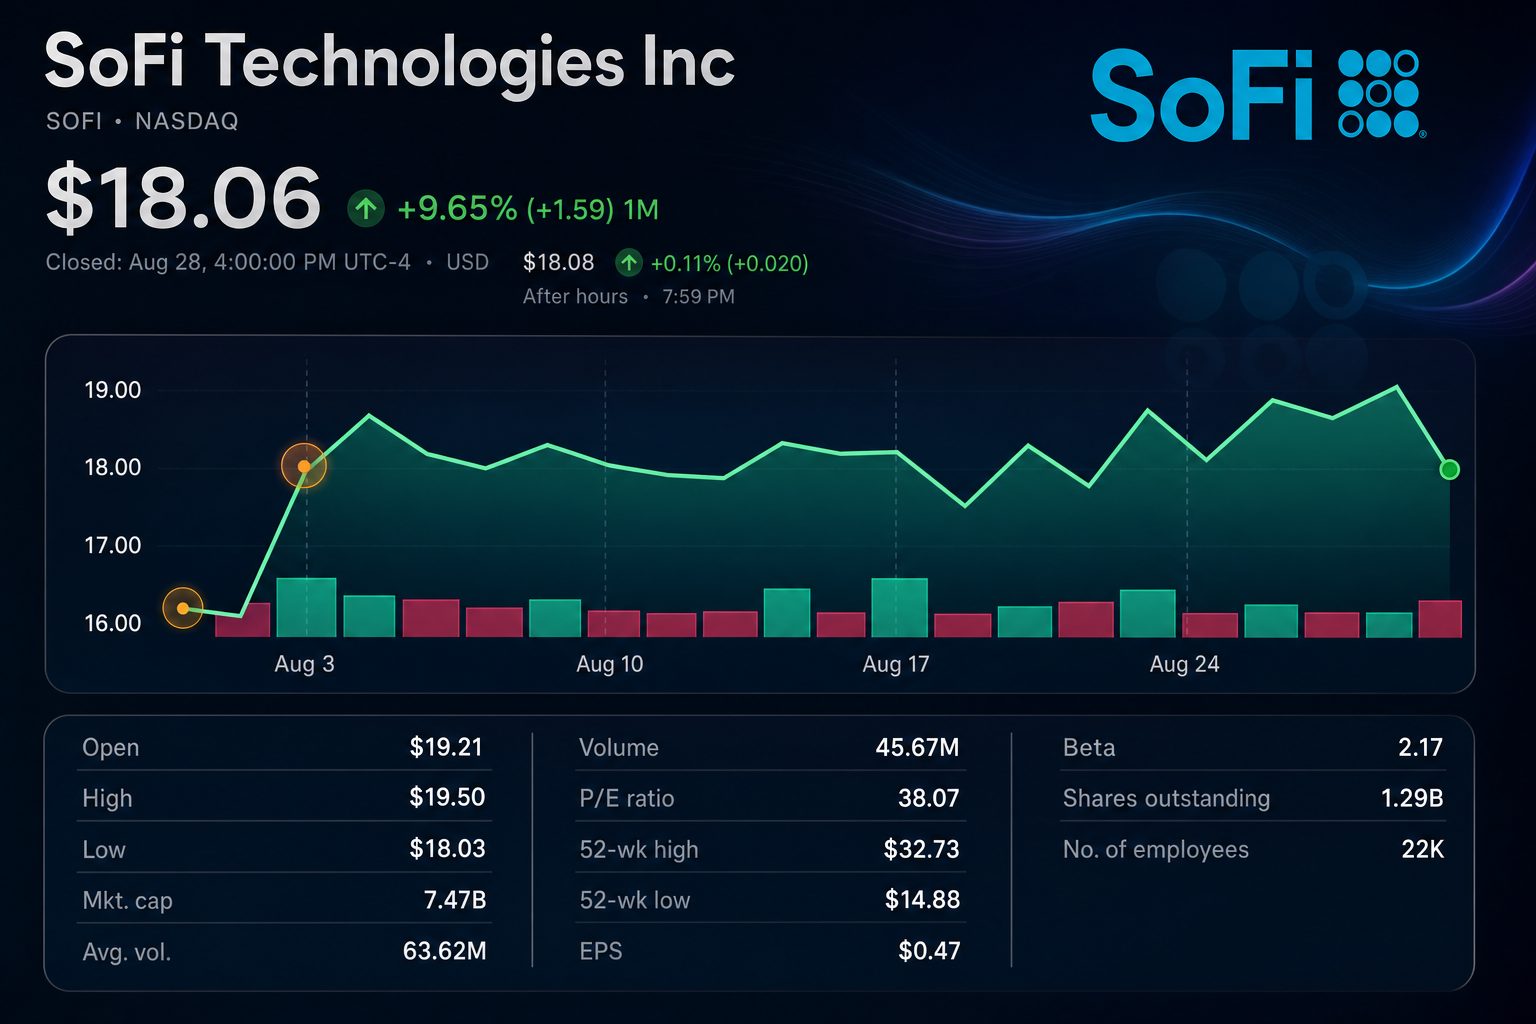
- SoFi closed Friday at $18.06, down 5.84%, on 45.67 million shares.
- The decline erased about $1.4 billion of equity value.
- Second-quarter revenue rose 43%, while Technology Platform revenue fell 23%.
- The stock trades near 30 times management’s unchanged 2026 adjusted EPS guide.
SoFi Technologies (NASDAQ: SOFI) lost 5.84% on Friday, closing at $18.06. The move erased roughly $1.4 billion from its equity value.
The slide sharpened a familiar question. SoFi is growing faster than most banks, but investors still demand evidence that growth can lift per-share profit.
Friday’s volume reached 45.67 million shares. That was only 61% of the 65-day average, suggesting broad de-risking rather than a company-specific capitulation MarketWatch.
The stock now carries a $23.33 billion market value. That equals 4.9 times the midpoint of management’s 2026 adjusted revenue forecast.
The valuation is steeper on earnings. At $18.06, SoFi trades near 30 times its unchanged 60-cent adjusted EPS guide.
| Metric | Q2 2026 | Q2 2025 | Change |
|---|---|---|---|
| GAAP net revenue | $1.219 billion | $854.9 million | +43% |
| GAAP net income | $156.6 million | $97.3 million | +61% |
| Adjusted EBITDA | $357.8 million | $249.1 million | +44% |
| Members | 15.8 million | 11.7 million | +35% |
| Technology Platform revenue | $84.5 million | $109.8 million | -23% |
The operating picture remains strong. Second-quarter GAAP revenue rose 43% to $1.219 billion, while net income increased 61% to $156.6 million company release.
Members grew 35% to 15.8 million. Products increased 42% to 24.4 million, with existing members opening 51% of new products.
Lending drove the quarter. Originations reached a record $14.8 billion, while net interest income rose 52% to $788.2 million.
The weaker point sits in technology services. Revenue there declined 23% after a large client completed its migration off the platform.
Management lifted adjusted revenue guidance to $4.75 billion-$4.85 billion. It retained adjusted EBITDA guidance near $1.6 billion and adjusted EPS at 60 cents.
That split mattered after the July report. TD Cowen said the earnings beat was tempered by unchanged profit guidance, while analysts’ revenue estimate stood at $4.7 billion Reuters.
Wall Street remains divided. MarketWatch lists 27 analyst ratings, while Wells Fargo reaffirmed a Hold recommendation on August 25.
The balance sheet provides support. Tangible book value reached $7.34 per share, leaving the stock at roughly 2.5 times tangible book.
Risks: Faster credit losses could compress lending returns. A prolonged Technology Platform contraction, weaker deposit growth or higher funding costs could also delay margin expansion.
The next test is simple. SoFi must convert record member and loan growth into a higher per-share profit forecast.
Related articles: NASDAQ:SOFI