
NEW YORK, August 4, 2026, 18:12 EDT — U.S. cash trading ended; notable activity continues in after-hours.
- Second-quarter revenue totaled $10.054 billion, surpassing the LSEG consensus by 6.7%. Adjusted earnings per share were 11.9% above forecasts.
- Five top growth brands reported a year-over-year gain of $923 million, while five significant decliners posted a combined loss of $772 million.
- Amgen increased its 2026 revenue midpoint by $1 billion, and lifted the adjusted EPS midpoint by $0.50.
Amgen Inc. NASDAQ:AMGN increased its 2026 revenue midpoint forecast by $1 billion. Five key brands delivered a combined $923 million in year-over-year quarterly sales gains, accounting for 120% of the company’s $766 million rise in product sales.
The shortfall was significant. Five struggling brands saw losses of $772 million, wiping out 84% of the combined gains of the five outperformers. Nevertheless, total product sales increased by 9%.
Revenue was $10.054 billion, exceeding LSEG’s forecast by 6.7%. Adjusted earnings per share surpassed consensus by 11.9%. Both figures were higher than expected.
Quarterly performance report
| Metric | Q2 2026 | Q2 2025 | Street estimate | Change or surprise |
|---|---|---|---|---|
| Revenue | $10.054 bln | $9.179 bln | $9.42 bln | Up 9.5% YoY; 6.7% above forecast |
| Product sales | $9.537 bln | $8.771 bln | — | Increase of 8.7% YoY |
| Adjusted EPS | $6.29 | $6.02 | $5.62 | 4.5% up YoY; 11.9% over estimate |
| GAAP EPS | $4.37 | $2.65 | — | Up 64.9% YoY |
| Adjusted operating margin | 48.4% | 48.9% | — | Decrease of 0.5 percentage point |
| Free cash flow | $3.5 bln | $1.9 bln | — | Jump of 84.2% YoY |
Amgen disclosed the results; Reuters cited LSEG consensus figures. Percentage change calculations are included.
Chief Executive Robert Bradway reported that six primary growth drivers increased by 26%, accounting for almost 70% of product sales. “We remain confident in our ability to deliver growth well into the next decade,” he said. Amgen Inc.
Amgen’s global markets and policy head, Murdo Gordon, underscored the balance on pricing. “Amgen is growing because we are serving more patients at lower unit prices,” he told Reuters. Reuters
Sales replacement test — $ millions
| Growth brand | Q2 sales | YoY change | Declining brand | Q2 sales | YoY change |
|---|---|---|---|---|---|
| Repatha | 953 | +257 | Prolia | 759 | -363 |
| Evenity | 714 | +196 | Xgeva | 352 | -180 |
| Uplizna | 335 | +159 | Otezla | 491 | -127 |
| Pavblu | 287 | +157 | Kyprolis | 314 | -64 |
| Imdelltra | 288 | +154 | Mvasi | 153 | -38 |
| Five-brand sum | 2,577 | +923 | Five-brand sum | 2,069 | -772 |
Figures are based on Amgen’s disclosed product sales for the two periods.
The top five performers increased by 56% and accounted for 27% of product revenue. The rest of the portfolio contributed an additional $615 million. Amgen reported that 22 of its products saw growth of at least 10%.
The composition continued to pressure adjusted profits. Operating costs increased by 11%, with research expenditures up 10%. The adjusted margin declined by 0.5 percentage points to 48.4%.
Free cash flow increased to $3.5 billion, up from $1.9 billion. The prior period reflected a final repatriation-tax payment. Debt was unchanged at $57.3 billion, with cash holdings at $14.0 billion.
2026 outlook revised
| Metric | Previous range | New range | Previous midpoint | New midpoint | Midpoint change |
|---|---|---|---|---|---|
| Revenue | $37.1–$38.5 bln | $38.2–$39.4 bln | $37.8 bln | $38.8 bln | +$1.0 bln; +2.6% |
| Adjusted EPS | $21.70–$23.10 | $22.30–$23.50 | $22.40 | $22.90 | +$0.50; +2.2% |
| GAAP EPS | $15.62–$17.10 | $15.80–$17.08 | $16.36 | $16.44 | +$0.08; +0.5% |
| Capital spending | About $2.6 bln | About $2.6 bln | — | — | No change |
| Share-buyback ceiling | $3.0 bln | $3.0 bln | — | — | No change |
Amgen’s latest and earlier outlook figures serve as the basis for midpoints and percent change calculations.
The midpoint for revenue was raised by 2.6%, while the midpoint for adjusted EPS climbed 2.2%. This outlook maintains most of the sales uplift at the adjusted earnings level.
MariTide is still the primary obesity catalyst. Phase 3 trials are evaluating dosing intervals of one month, eight weeks, and three months. The first comprehensive data are due in 2027. Amgen has discontinued any further progress with AMG 513.
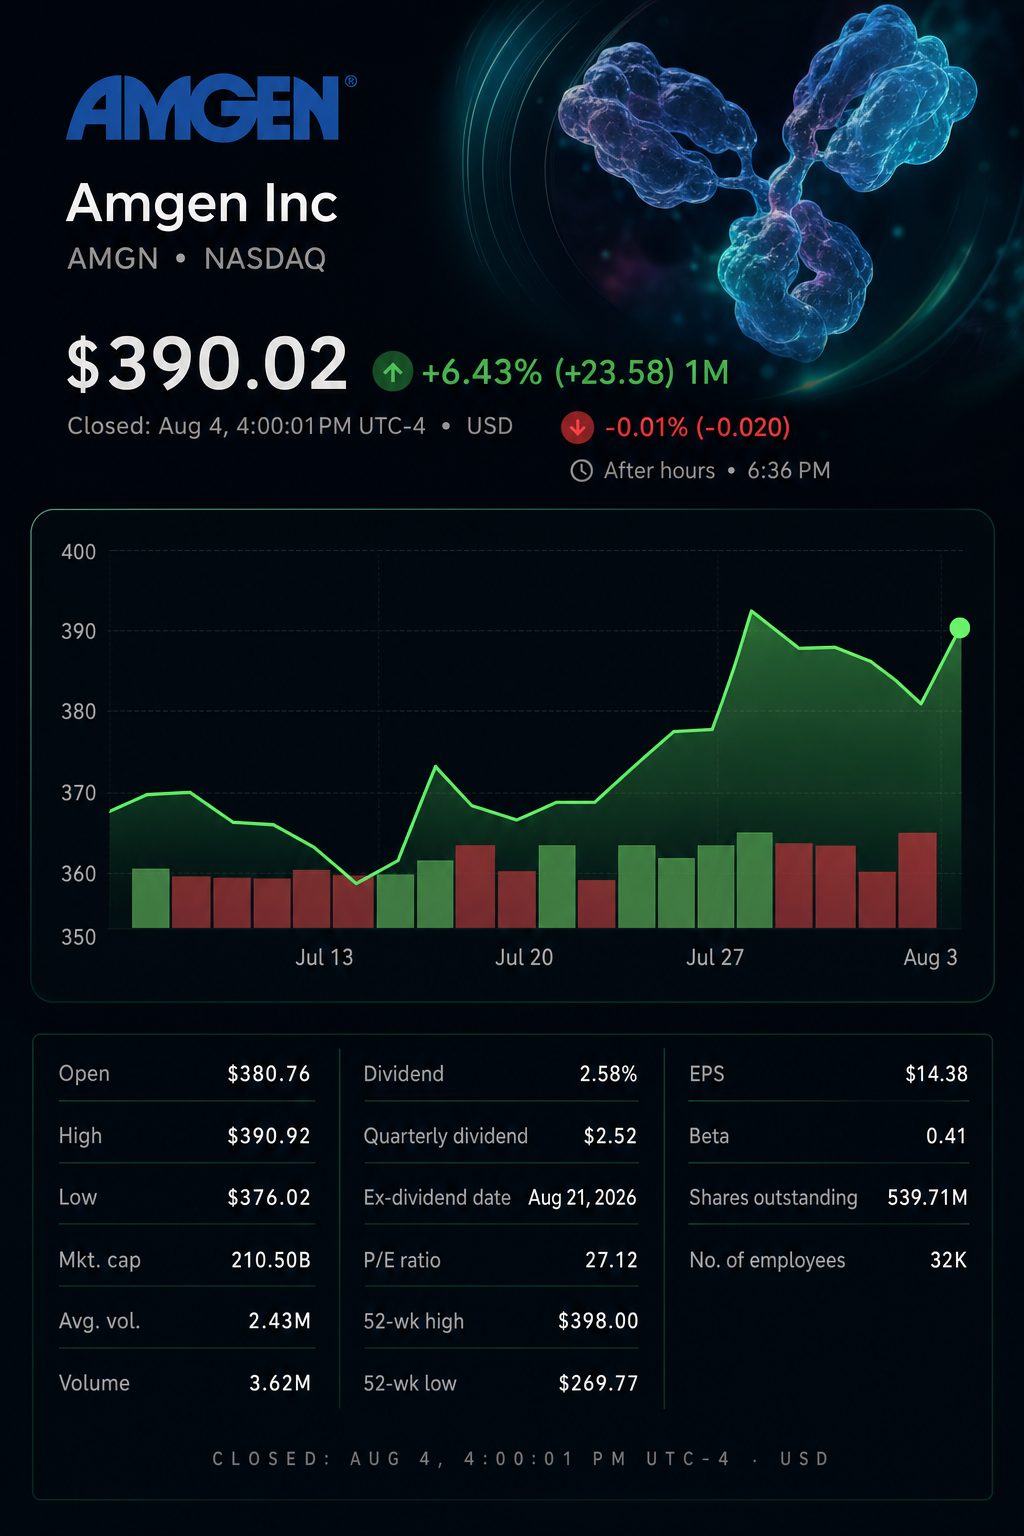
The stock advanced 2.4% over the week ending July 31. On Tuesday, it climbed 2.94% to close at $390.02. A late price quote indicated a level of $390.99 at 18:07 EDT, reflecting a 0.25% gain after the market closed.
With that closing price, Amgen traded at roughly 27 times its trailing GAAP earnings. This valuation multiple is higher than those of the two large biotech peers listed below.
Overview of leading biotech company valuations
| Company | Latest price | Market value | Trailing GAAP P/E |
|---|---|---|---|
| Amgen NASDAQ:AMGN | $390.02 | $212.2 bln | 27.1x |
| Gilead Sciences NASDAQ:GILD | $135.25 | $169.6 bln | 18.4x |
| Regeneron Pharmaceuticals NASDAQ:REGN | $760.66 | $80.6 bln | 18.8x |
| Biogen NASDAQ:BIIB | $208.45 | $31.0 bln | 37.0x |
The most recent August 4 market snapshots are shown. Trailing ratios do not reflect adjustments for portfolio or accounting differences.
The valuation remains moderate for the biotech sector. This keeps execution as a key factor. Setbacks with MariTide or a quicker decline from biosimilar competition could lower the premium.
The initial full cash-session reaction arrives on Wednesday. Eli Lilly and Company NYSE:LLY will report at 10:00 EDT. Novo Nordisk A/S NYSE:NVO schedules its call for 07:00 EDT. Updates from both on obesity could shift MariTide expectations.
Risks: Quarterly sales from Prolia and Xgeva dropped by a combined $543 million. Adjusted margin declined even as revenue rose. With AMG 513 discontinued, obesity pipeline focus shifts to MariTide. Outstanding debt stands at $57.3 billion.


![US Stock Market Today 08/27/2026 [UPDATE: 00:01 EDT] [NVIDIA Leads AI Earnings Bid Across Midnight]](https://ts2.tech/wp-content/uploads/2026/08/US-market-dashboard-2026-08-27-0000-480x384.jpg "US Stock Market Today 08/27/2026 [UPDATE: 00:01 EDT] [NVIDIA Leads AI Earnings Bid Across Midnight]")
![Australia Stock Market Today 27/08/2026 [UPDATE: 13:40 AEST] [Spending Beat Pins ASX Near Session Low as MinRes Gains]](https://ts2.tech/wp-content/uploads/2026/08/AU-market-dashboard-2026-08-27-1340-480x384.jpg "Australia Stock Market Today 27/08/2026 [UPDATE: 13:40 AEST] [Spending Beat Pins ASX Near Session Low as MinRes Gains]")