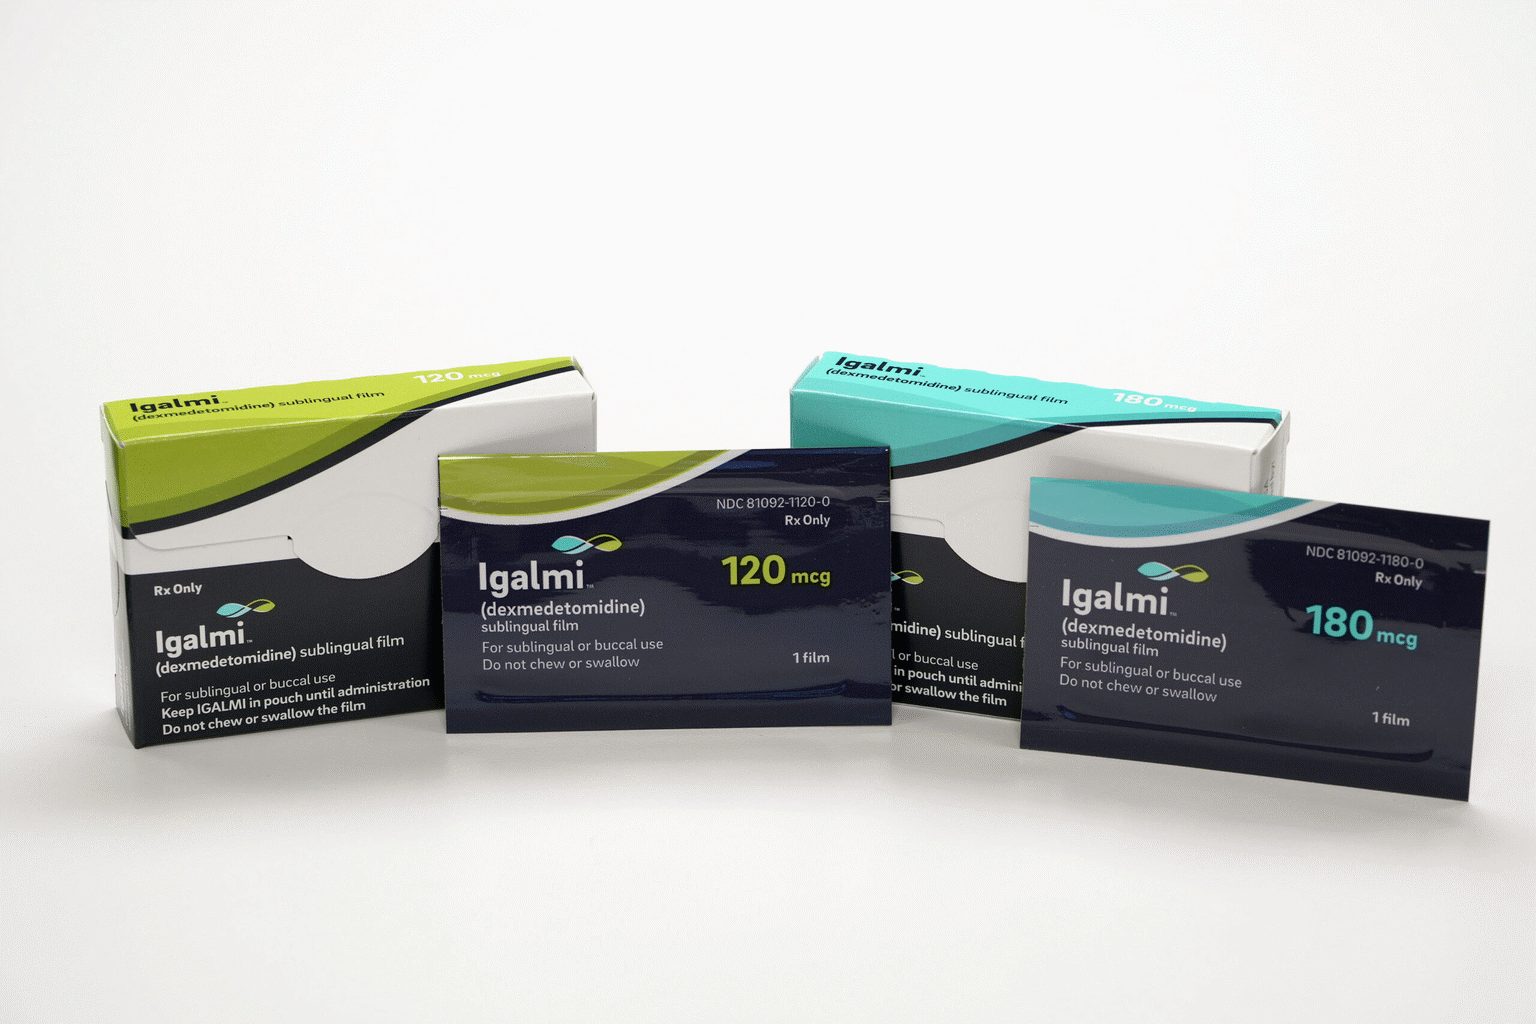
Pfizer Inc. edged down 0.2% on Friday, closing at $27.96. The modest change belies a more pronounced battle between expanding sales from key drugs and falling COVID revenues.
| Company | P/E | Move |
|---|---|---|
| Pfizer | 36.8× | -0.2% |
| J&J | 31.1× | +0.8% |
| Merck | 118.7× | -0.8% |
| Eli Lilly | 39.4× | -0.2% |
Pfizer trades near 9.6× the midpoint of adjusted 2026 EPS guidance. The trailing multiple is distorted by impairments.
| First-half dividends | $4.9bn |
| Internal R&D | $5.3bn |
| 2026 buybacks | $0 |
| Indicated yield | 6.15% |
| Cost savings by end-2026 | $5.7bn |
Core products must outrun a roughly $4 billion COVID franchise. Patent losses, pricing pressure and integration charges can absorb the benefit of launched-product growth.
Sources: Pfizer Q2 2026 release and investor relations; market data timestamped above. Guidance and non-GAAP measures are management figures.
The clinical breakthrough now faces a cash and commercialization test.
| Q2 / outlook | Value | Signal |
|---|---|---|
| Revenue | $145M | +2% YoY |
| Net loss | −$782M | 5.4× revenue |
| R&D | $651M | −7% YoY |
| June cash | $6.9B | −$600M QoQ |
| 2026 year-end cash | $4.7B–$5.2B | Company guide |
| Metric | Value |
|---|---|
| IGALMI revenue | $0.206M |
| Cost of goods sold | $0.283M |
| R&D expense | $3.0M |
| SG&A expense | $7.2M |
| Operating loss | $10.2M |
| Net loss | $12.7M |
| Cash + restricted cash | $17.2M |
Quarter-end cash equaled about 1.35 times the first-quarter net loss. Revenue did not cover product cost.
| Asset continuity | IGALMI remains available |
| Auction outcome | Higher bids possible |
| Milestones | Up to $67.5M, not guaranteed |
| Common stock | Residual claim |
The November FDA date matters for the asset's future, but Chapter 11 priority determines whether that value reaches existing shareholders.
Regulatory clearance is complete; royalties now depend on partner-led demand.
| Revenue channel | Economics | What changed |
|---|---|---|
| Sanofi royalties | High teens–low 20s % of global net sales | U.S. and EU seasonal approvals enable sales |
| Takeda | Royalties plus annual approval milestones | Japan approval supports 2026–2027 season |
| Sanofi supply | Recorded as product sales | Commercial supply planned this season |
| Technology transfer | $75M potential milestone | Expected mid-2027 |
Excludes Sanofi supply sales, royalties and milestones.
Versus $751M at Dec. 31, 2025
| Q2 2026 | Value | Year-over-year |
|---|---|---|
| Total revenue | $57M | −76% |
| Product sales | $19M | +76% |
| Net loss | $53M | vs. $107M profit |
| Net R&D expense | $48M | −34% |
| SG&A expense | $27M | −39% |
+47% from $9.00
| High | $19.00 |
| Low | $7.00 |
| Ratings | 2 Buy · 1 Hold · 1 Sell |
Approvals remove regulatory risk, but the stock's muted reaction signals demand uncertainty. The core sensitivities are vaccine uptake, coverage policy, Sanofi execution and timing of royalty recognition. Management gives no Sanofi sales forecast.
Sources: Novavax Aug. 28 approval update and Aug. 6 financial results; Reuters Aug. 27 FDA report; Google Finance. Prices are delayed U.S. quotes at 11:58 EDT on Aug. 28, 2026.
| Endpoint | MYQORZO | Placebo | Net effect | p-value |
|---|---|---|---|---|
| KCCQ-CSS | +11.4 | +8.4 | +3.0 pts | 0.021 |
| Peak VO2 | +0.64 | −0.03 | +0.67 ml/kg/min | 0.003 |
| NYHA class improvement | 41.9% | 27.8% | +14.1 pts | <0.001 |
| NT-proBNP ratio | 0.43 | 1.00 | 0.43 | <0.001 |
Left-atrial volume and time to first cardiovascular event did not reach significance. Two treated patients had serious heart-failure events associated with LVEF below 50%.
Q2 product cost was $2.7M. Early inventory and launch timing limit direct run-rate comparisons.
Investor lens: the Phase 3 win expands MYQORZO's possible revenue base, but Friday's decline prices in questions about clinical magnitude, monitoring burden and launch spending.
The ADSs opened at $102.34, traded as low as $98.80, then recovered part of the decline.
The monitoring board found a numerical overall-survival imbalance between arms and judged further continuation unlikely to change efficacy.
Stage II high-riskStage IIIctDNA-positivePost-surgery| Measure | Latest | Investor signal |
|---|---|---|
| Q2 revenue | €105.6m | Down 59.5% year over year |
| Q2 R&D expense | €551.0m | Heavy oncology investment continues |
| Q2 net loss | €820.8m | Up 112% year over year |
| 2026 revenue guide | €1.6–€1.9bn | Already reduced in August |
| 2026 adjusted R&D guide | €2.0–€2.3bn | Capital allocation becomes more important |
| Share repurchase authorization | Up to $1.0bn | Potential downside buffer, market-dependent |
Liquidity can absorb program failure, but repeated negative readouts would compress pipeline valuation.
| Consensus | Buy |
| Average target | $121.51 |
| Median target | $129.75 |
| Low / high | $76.14 / $145.26 |
| Coverage | 20 analysts |
Snapshot checked Aug. 28; ratings predate the trial termination.
Bull case: the stop saves future study spending and cash is redirected to stronger assets. Bear case: the survival signal weakens confidence in personalized mRNA oncology and raises scrutiny across partnered programs.
Reference points: $137.25 open, $147.77 high, $134.07 low, $137.86 latest.
Initial conversion equals roughly 3.1% of the June share base. The capped call is designed to offset dilution, but only up to its cap.
2032 maturityRule 144ASenior unsecured| Measure | Term | What it changes |
|---|---|---|
| Initial conversion | $210.58 | 47.5% premium to Thursday close |
| Capped-call ceiling | $392.6175 | Hedge protection to 175% premium |
| Expected net proceeds | $2.563bn | About 37% of June liquidity |
| Capped-call cost | $285m | About 11% of base net proceeds |
| Buyer option | Up to $400m | Could lift net proceeds near $2.96bn |
The financing replenishes flexibility after the settlement payment and ongoing research spending.
| Q2 revenue | $145m |
| Q2 EPS | −$1.97 |
| 2026 revenue plan | Up to +10% |
| Year-end cash guide | $4.7–$5.2bn |
| Analyst consensus | Hold |
| Average target | $106.63 |
Bull case: zero-coupon funding protects oncology momentum and the hedge limits dilution. Bear case: the stock remains above consensus value while cash burn and vaccine demand stay uncertain.
Eli Lilly · NYSE: LLY · Market data at August 28, 2026, 09:44:26 EDT
| New indication | CV risk reduction in high-risk adults with type 2 diabetes |
| Comparator | Trulicity |
| MACE-3 hazard ratio | 0.92 (95.3% CI: 0.83–1.01) |
| Relative event rate | 8% lower |
| All-cause mortality | 16% lower |
| Statistical result | Noninferior; not superior |
| Product | Q2 2026 sales | Growth |
|---|---|---|
| Mounjaro worldwide | $9.9B | +91% |
| Mounjaro U.S. | $4.8B | +45% |
| Mounjaro ex-U.S. | $5.2B | +172% |
| Zepbound U.S. | $4.9B | +44% |
| Lilly total | $22.97B | Quarter ended June |
Mounjaro as a share of Lilly revenue
43.3%
Mounjaro plus Zepbound as a share of Lilly revenue
64.4%
The label expansion is material because tirzepatide already supplies nearly two-thirds of quarterly revenue.
| Friday open | $1,172.66 |
| Early range | $1,164.32–$1,174.00 |
| 52-week range | $712.05–$1,292.65 |
| P/E ratio | 39.22× |
| Average volume | 2.65M shares |
| Analyst ratings | 18 Buy · 2 Hold · 0 Sell |
Lower realized prices already offset part of U.S. volume growth. Rebate pressure, supply tightness and Novo Nordisk competition can limit incremental revenue. The medicine carries warnings including thyroid C-cell tumors and pancreatitis.
Sources: Lilly, Reuters, PubMed, Lilly Pricing Information and Google Finance. Market data are timestamped above.
Roivant Sciences (NASDAQ: ROIV) · Market data at August 28, 2026, 09:39:23 EDT
| Previous close | $37.58 |
| Friday open | $37.01 |
| Early range | $36.49–$37.13 |
| 52-week range | $11.85–$37.95 |
| Average volume | 5.36M shares |
| Measure | LISRAYA 30mg | Placebo |
|---|---|---|
| Mean TIS, week 52 | 46.5 | 31.2 |
| Advantage | +15.3 points | — |
| Treatment discontinuation | 6% | 11% |
| Trial size | 241 adults; 52 weeks | |
Peak-sales estimate as a share of current equity value
7.6% · $2.0B / $26.42B
| Cash and securities, June 30 | $3.9B |
| Quarterly net loss | $290.6M |
| Quarterly R&D | $202.0M |
| Quarterly revenue | $1.4M |
| Share repurchases | $208.7M |
| Event | Status | Investor test |
|---|---|---|
| FDA approval | Completed Aug. 27 | Regulatory risk removed |
| Specialty-pharmacy launch | Immediate | Prescription conversion |
| Pricing disclosure | Pending | Gross-to-net revenue |
| Payer coverage | Developing | Launch velocity and access |
Pricing remains undisclosed. Payer restrictions could slow uptake in a small patient population. LISRAYA carries boxed warnings for serious infections, malignancy, major cardiovascular events and thrombosis.
Sources: FDA, Roivant, Reuters, Roivant quarterly results and Google Finance. Trial and financial data are company-reported unless noted.
| Layer | Count | Price | Cash |
|---|---|---|---|
| New ADSs | 2.580M | $15.50 package | $40M |
| Series A | 2.243M | $17.825 | ≈$40M |
| Series B | 2.064M | $19.375 | ≈$40M |
Warrant cash is contingent on exercise. Figures are gross and exclude fees.
evaluable Stage IV TNBC patients showed clinical benefit.
Phase 1b, small and preliminary; not powered for statistical significance.
| Cash, Dec. 31, 2025 | A$69.46M |
| Half-year operating cash use | A$9.54M |
| Half-year net loss | A$12.55M |
| Average target | $28.60 |
| Low / high | $18 / $34 |
Google Finance, August 28. Most targets predate this financing.
Aug. 31, 2026
Expected offering close
July 2027
Expected TNBC enrollment completion
H2 2027
Stage IV TNBC readout / Series A trigger
H1 2028
HR+/HER2− readout / Series B trigger
The $40 million primary sale equals roughly 22% of Thursday's $181.38 million reported market value. It improves funding capacity, but the full security stack can expand the simplified ADS count sharply. The decisive questions are whether larger cohorts confirm the six-patient signal and whether the shares exceed both warrant strikes.
Sources: Kazia offering release and half-year report; Kazia paxalisib update; Google Finance. Share-count analysis is simplified and may differ from legal fully diluted capitalization because pre-funded and legacy instruments are not fully reconciled.
Cash extension versus warrant dilution
| Investor metric | Value | Read-through |
|---|---|---|
| Warrants per new ADS | 1.5× | Large embedded dilution incentive |
| Simplified fully diluted pool | ≈8.0M ADS equivalents | Existing base becomes ≈54% |
| Raise / March cash | ≈22% | Meaningful but not transformative |
| Raise / Q1 operating cash use | ≈1.6× | About 1.6 quarters before fees |
| Expected close / Q2 report | Aug. 31, 2026 | Financing and updated cash meet |
The raise supports GLIX1 development and working capital. It supplements a cash balance previously guided into the first half of 2027.
New and amended warrants cluster at $2.78. Exercises can add capital, but they may cap upside and reduce each existing holder’s ownership.
Sources: BioLineRx offering release and Q1 2026 results; StockAnalysis premarket quote. Market figures timestamped 28 Aug 2026, 08:19 EDT. Dilution figures are simplified estimates and exclude other securities or later share-count changes.
QRX003 Phase 2/3 interim data · Market data at 07:34 EDT, August 28, 2026
Four patients achieved at least a one-grade IGA improvement. The study is open-label and plans about 20 evaluable participants.
| Interim cutoff | 6 patients |
| Treatment duration | 12 weeks |
| Recruitment completion | End-2026 |
| Full topline data | Q2 2027 |
| Regulatory status | Investigational |
QRX003 has U.S. Orphan Drug, Rare Pediatric Disease and Fast Track designations. None guarantees approval.
| Security | Count | Price |
|---|---|---|
| ADSs / pre-funded equivalents | 6.31M | $4.88 |
| Ordinary warrants | 3.15M | $6.10 |
| Existing ADSs | 2.01M | — |
$30.8M upfront; another $19.2M depends on investors exercising warrants.
Simplified ADS-equivalent calculation; excludes other outstanding options and warrants.
The trial crossed its adjusted statistical hurdle and reported no treatment-related serious adverse events. That improved the perceived probability of clinical success.
The financing simultaneously removed a near-term cash constraint. Yet the new ADS equivalents can make existing holders a much smaller share of the company.
Premarket quote
$7.31
Placement price
$4.88 · 33.2% discount
Warrant exercise
$6.10 · 16.6% below quote
June cash + investments: $10.8MQ2 net loss: $5.37MUpfront raise: $30.8M
Management expects full financing proceeds to fund operations into the second half of 2029.
Six-patient sampleOpen-label designFull cohort pendingRegulatory riskDilutionWarrant overhang
A positive interim endpoint can weaken or disappear as enrollment grows.
Sources: Quoin August 28 clinical and financing releases; June-quarter results; StockAnalysis premarket quote. Calculations use ADS equivalents and may differ due to rounding.
Chapter 11 turns a pipeline valuation into a recovery waterfall.
Commercial revenue remained small relative to losses. Before court protection, available cash represented roughly 1.5 quarters of the cited operating burn.
| Firm | Rating | Target | Upside |
|---|---|---|---|
| Raymond James | Strong Buy | $30 | 86% |
| RBC Capital | Outperform | $23 | 43% |
| Asset | Status | Investor signal |
|---|---|---|
| Opakalim / BHV-7000 | Licensed to SK Biopharmaceuticals | Cash now; royalties and milestones later |
| BHV-1300 | Pivotal Graves’ disease study | Late-2027 data is the central readout |
| Remaining pipeline | Clinical-stage | Must justify the $2.43B equity value |
Biohaven exchanged part of opakalim’s long-term upside for immediate balance-sheet strength. The 4.9% decline and above-average volume show investors are recalibrating that trade. The next valuation test is whether BHV-1300 can turn a longer runway into credible pivotal data.
| Registry field | Before | Aug. 26 update |
|---|---|---|
| Site footprint | Original site set | Baylor College of Medicine added |
| Recruitment | Not yet recruiting | Unchanged |
| Enrollment | 20 | Unchanged |
| Estimated start | Jul. 31, 2026 | Aug. 31, 2026 |
| Primary/final completion | Mar. 31, 2027 | Aug. 31, 2027 |
| Path | Confirmation signal | What would challenge it |
|---|---|---|
| Bull | Recruitment begins; FDA pathway gains clarity; short covering persists | Further trial slippage or weak dosing demand |
| Base | Registry edit stays procedural; shares consolidate into the next data event | Company-specific disclosure changes the evidence set |
| Bear | Delay and safety concerns dominate; squeeze fades | Fast activation plus credible label-expansion progress |
Propanc also reported fewer liver and peritoneal metastases. It said PRP increased sensitivity to gemcitabine/nab-paclitaxel in resistant cells. These are company-reported preclinical findings.
| Cash | $0.44M |
| Nine-month operating cash use | $4.08M |
| Nine-month revenue | $0 |
| Nine-month net loss | $14.29M |
| Going concern | Substantial doubt |
Company filing for the period ended March 31, 2026.
| Signal | Why it matters | Next verification |
|---|---|---|
| Preclinical efficacy | Large reported effect created attention | Independent reproduction and full dataset |
| Regulatory execution | Unlocks first human dosing | Clinical-trial application acceptance |
| Manufacturing | Required for dosing consistency | GMP batch completion and release |
| Financing | No revenue and limited cash | Funding terms, dilution and runway |
| Analyst coverage | No broad consensus located | Institutional initiation or published estimates |
Animal-model success frequently fails to translate into patients. PRP has not established human safety or efficacy. Regulatory delay, manufacturing problems, thin trading liquidity and equity financing could reverse Thursday’s gain quickly.
Sources: Propanc releases dated Aug. 18 and Aug. 27, 2026; Propanc Form 10-Q for March 31, 2026; market data at 11:41 ET.
Intraday snapshot: August 27, 2026, 10:15:13 EDT
The stock recovered from its session low but remained 5.0% below Wednesday’s close.
The market erased about $2.97 billion while Moderna proposed $2.0 billion of base financing.
| Term | Current disclosure |
|---|---|
| Security | Senior unsecured convertible notes |
| Maturity | 2032 |
| Regular interest | None |
| Purchaser option | $300M for 13 days |
| Settlement | Cash, shares or both |
| Capped-call threshold | At least 150% premium at pricing |
| Metric | Amount | Read-through |
|---|---|---|
| Cash + investments | $6.9B | June 30 |
| Q2 operating cash outflow | $526M | Base notes = 3.8× |
| Q2 net loss | $782M | Base notes = 2.6× |
| July settlement payment | $950M | Post-quarter cash use |
| 2026 year-end cash guide | $4.7B–$5.2B | Before new deal update |
23 analysts · average target $104.53
Target dispersion is wide after the oncology-data rally. The financing terms now add a separate dilution and balance-sheet variable.
The financing converts part of the recent oncology revaluation into liquidity. No regular coupon limits cash interest, but conversion can expand the share count. The capped call only protects up to its final cap.
Pricing: conversion rate, premium and net proceeds.
Hedging: capped-call cost and counterparties’ trading.
Use of funds: oncology investment versus debt repayment.
Risk trigger: weaker clinical or regulatory progress after leverage rises.
Sources: Moderna August 27 financing announcement; Moderna July 31 quarterly results; Google Finance; MarketScreener. Calculations use the $142.20 share price and $56.54 billion market capitalization observed at 10:15:13 EDT on August 27, 2026. Values are rounded.
NYSE:BHVN • regular session • market data through August 27, 2026, 10:19 EDT
Thursday’s $1.20 decline gave back 46.7% of Wednesday’s $2.57 gain. The shares still held 9.5% above the pre-deal close.
$400M equals 1.48× June liquidity and 16.8% of current market value. The $795M ceiling includes contingent amounts.
| Component | Amount / rate | Investor meaning |
|---|---|---|
| Cash at closing | $350M | Non-refundable; subject to closing |
| Deferred upfront | $50M | Payable one year after closing |
| Development/regulatory | Up to $150M | Milestone-dependent |
| Knopp obligations | Up to $245M | Assumed by SK after closing |
| U.S. royalties | Mid-teens to low twenties | Requires approval and commercial sales |
| Ex-U.S. royalties | Mid-single digits | Lower overseas participation |
| June 30 liquidity | $270.5M |
|---|---|
| Q2 net loss | $137.3M |
| Q2 R&D | $100.8M |
| Q2 G&A | $24.1M |
| Illustrative post-close liquidity | $620.5M |
The illustrative balance adds $350M to June liquidity. It is not a forecast and excludes later spending, reimbursements and balance-sheet changes.
| Measure | Reading | Timestamp / basis |
|---|---|---|
| Thursday range | $15.50–$17.05 | 10:19 EDT |
| Thursday volume | 962,594 | 10:19 EDT |
| Wednesday volume | 15.77M | 5.2× 65-day average |
| 52-week range | $7.48–$18.57 | Through Aug. 27 |
| Consensus | Overweight | 11 Buy, 1 Overweight, 3 Hold, 1 Underweight |
| Average target | $22.07 | +40.1% vs. $15.75 |
| Target range | $10–$42 | −36.5% to +166.7% |
| Company | Price | Move | Market value |
|---|---|---|---|
| Biohaven BHVN | $15.68 | −7.49% | $2.36B |
| Vera Therapeutics VERA | $34.83 | −5.42% | $2.50B |
| Wave Life Sciences WVE | $5.07 | −3.15% | $1.03B |
| uniQure QURE | $50.22 | −1.43% | $3.33B |
Peer quotes are from 10:04–10:06 EDT. Biohaven underperformed this small clinical-biotech comparison at that snapshot.
Closing Antitrust clearance and customary conditions unlock the first $350 million.
2H 2026 RISE3 topline results test opakalim’s efficacy and the value of milestones and royalties.
After closing SK funds specified development costs while Biohaven continues RISE2, RISE3 and filing preparation.
Weak RISE3 data could reduce milestone and royalty value. Closing delay would postpone liquidity. SK also has post-closing termination rights, while Biohaven has traded direct commercial ownership for cash and royalties.
Sources: Biohaven Form 8-K, Biohaven Q2 results, WSJ/FactSet market and analyst data, and contemporaneous U.S. equity quotes. Calculations are derived from disclosed figures and may not sum because of rounding.
| Item | Current fact |
|---|---|
| Brand / drug | RASONQUE / daraxonrasib |
| Dose | 300 mg oral tablet once daily |
| U.S. status | Approved and available |
| Label | Metastatic pancreatic adenocarcinoma after prior systemic therapy, or when multiagent therapy is unsuitable |
| Diagnostic | No companion test required |
| International | EMA phased review; not approved outside the U.S. |
| Measure | RASONQUE | Chemotherapy | Investor read |
|---|---|---|---|
| Median overall survival | 13.2 months | 6.7 months | 60% lower death risk; HR 0.40 |
| Progression-free survival | 7.2 months | 3.6 months | Roughly doubled; HR 0.49 |
| Objective response rate | 30% | 11% | 19-point advantage |
| Trial size | 500 adults, randomized 1:1 | FDA approved 6.5 months early | |
| June 30, 2026 | Amount | Signal |
|---|---|---|
| Cash and investments | $3.94B | Launch and pipeline runway |
| Q2 research spending | $394.9M | Up from $224.1M |
| Q2 general costs | $110.2M | Commercial buildout lifted costs |
| Q2 net loss | $644.4M | Includes $151M warrant revaluation |
| FY2026 operating-cost guide | $2.1B–$2.2B | Execution remains capital intensive |
Public.com consensus checked Aug. 27, 2026. RBC kept Outperform after approval.
| Driver | Bull case | Pressure point |
|---|---|---|
| Access | Rapid payer coverage and early-access conversion | Prior authorization or reimbursement delays |
| Demand | Broad label without companion testing | Small eligible treated population or discontinuation |
| Net price | Limited discounting supports revenue per patient | Assistance and rebates widen gross-to-net gap |
| Safety | Oral regimen proves easier than chemotherapy | Skin toxicity, diarrhea, ILD or gastrointestinal events |
| Pipeline | Earlier-line and lung-cancer studies expand use | Trial setbacks leave valuation concentrated in one asset |
Information gain: the day’s $4.13 decline erased roughly $530 million of quoted equity value. The unlocked block itself was worth about $1.68 billion at $16.25.
GENB rose 26.4% from Aug. 21 through Aug. 25, then gave back nearly the entire advance. It remained 1.6% above the $16 IPO price at 15:06 EDT on Aug. 26.
| Metric | Latest | Investor read |
|---|---|---|
| Cash + securities | $457.4M | 21.9% of market cap |
| H1 operating cash use | $138.3M | Runway into H1 2028 |
| Q2 collaboration revenue | $6.3M | −37.7% year over year |
| Q2 net loss | $67.3M | Widened from $56.7M |
| Q2 GB-0895 external R&D | $20.5M | +54.3% year over year |
What changes next: ownership supply drove this session. September data can shift the focus back to GB-0895’s pharmacology and the twice-yearly dosing case.
As of Aug. 26, 2026. Morgan Stanley reiterated Buy with a $22 target on Aug. 17; Piper Sandler reiterated Buy with a $24 target on Aug. 7.
Bull case: little actual lock-up selling would make the 20% drop look like a temporary supply discount. Positive COPD data could strengthen the six-month dosing proposition ahead of larger severe-asthma readouts.
Risk case: sustained insider or venture-holder sales could cap rebounds. Weak September pharmacology, faster cash use, or Phase 3 delays would raise financing and dilution risk before commercialization.