
NEW YORK, August 1, 2026, 11:01 (EDT).
- Shares ended Friday at $18.76, down 0.1% for the week.
- Core earnings covered 98% of the dividend; net investment income covered 104%.
- July-funded investments yielded 10.0%, 170 basis points above exited assets.
U.S. markets were closed for the weekend. Ares Capital Corporation NASDAQ:ARCC finished Friday at $18.76, implying a 10.23% annualized regular yield. The shares stood 3.0% below June net asset value.
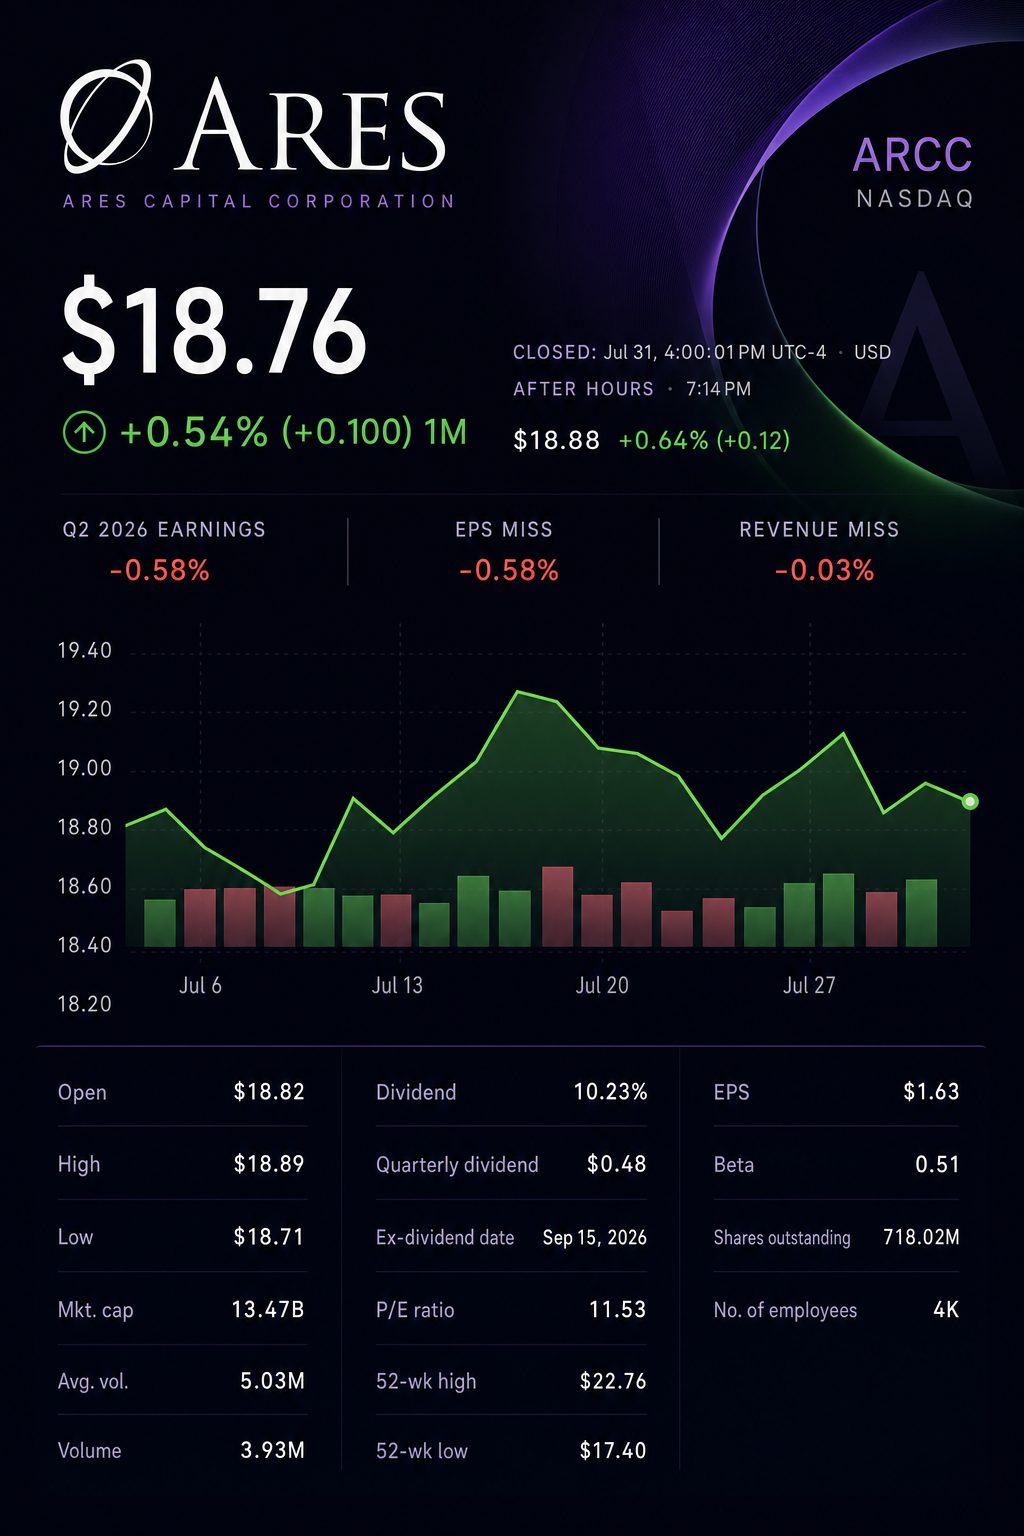
That discount pays investors for a thinner earnings cushion. Core earnings were $0.47 a share, one cent below the unchanged dividend.
Net investment income was stronger at $0.50 a share. Management’s preliminary spillover estimate was $988 million, or $1.38 a share. That equals nearly three current quarterly payouts.
Earnings and dividend coverage
| Per-share metric | Q2 2026 | Q1 2026 | Q2 2025 |
|---|---|---|---|
| Core earnings | $0.47 | $0.47 | $0.50 |
| Net investment income | $0.50 | $0.55 | $0.49 |
| Regular dividend | $0.48 | $0.48 | $0.48 |
| Core-earnings coverage | 98% | 98% | 104% |
| NII coverage | 104% | 115% | 102% |
| GAAP earnings | $0.24 | $0.13 | $0.52 |
Company filings; coverage ratios calculated from reported figures.
The quarter was steady, not clean. Total investment income rose 3% from a year earlier. Interest and credit-facility fees rose 14%.
The shares fell 1.7% on July 29, the reporting day. They recovered enough to finish the week down only 0.1%.
Credit marks were the larger drag. Unrealized losses reached $183 million, while NAV fell 3.0% from year-end.
Portfolio and balance-sheet comparison
| Metric | June 30, 2026 | Dec. 31, 2025 | Change |
|---|---|---|---|
| NAV per share | $19.35 | $19.94 | -3.0% |
| Portfolio fair value | $29.35 billion | $29.49 billion | -0.5% |
| Gross debt-to-equity | 1.15x | 1.12x | +0.03x |
| Nonaccruals at cost | 2.4% | 1.8% | +0.6 points |
| First-lien portfolio share | 59% | 61% | -2 points |
Changes calculated from Ares Capital’s reported figures.
Chief Executive Kort Schnabel cited “consistent Core Earnings” and healthy portfolio performance. The reported figures still show gradual slippage from year-end. SEC
The constructive signal appeared after quarter-end. July-funded investments yielded 10.0%, against 8.3% on exits.
That replacement spread was 170 basis points. A $1.5 billion backlog could turn those economics into recurring income.
Deployment economics
| Metric | Q2 2026 | July 1–23 | Difference |
|---|---|---|---|
| New commitments | $2.592 billion | $244 million | July is partial |
| Investment exits | $2.915 billion | $132 million | July is partial |
| New commitments less exits | -$323 million | +$112 million | Turned positive |
| Yield on funded debt | 9.4% | 10.2% | +80 basis points |
| Yield on all funded investments | 9.1% | 10.0% | +90 basis points |
| Funded yield versus exit yield | — | 10.0% vs. 8.3% | +170 basis points |
| Investment backlog | — | $1.5 billion | 5.1% of portfolio |
July figures cover activity through July 23. Backlog percentage is calculated against June portfolio fair value.
Funding may help too. Chief Financial Officer Scott Lem called commercial paper a “lower-cost source of capital.” The $1 billion program is backed by the main revolving facility. SEC
Peer trading underscored the focus on coverage. Hercules Capital, Inc. NYSE:HTGC gained 2.9% Friday after posting $0.50 of NII. Its base-dividend coverage was 125%.
Three large peers report next week. Blue Owl Capital Corporation NYSE:OBDC reports Wednesday. Blackstone Secured Lending Fund (NYSE:BXSL) and Main Street Capital Corporation NYSE:MAIN report Thursday.
BDC market and reporting calendar
| Company | Friday close | Friday move | Market value | Next scheduled event |
|---|---|---|---|---|
| Ares Capital Corporation NASDAQ:ARCC | $18.76 | -0.3% | $13.47 billion | Reported July 29 |
| Hercules Capital, Inc. NYSE:HTGC | $16.42 | +2.9% | $3.28 billion | Reported July 30 |
| Blue Owl Capital Corporation NYSE:OBDC | $10.75 | -0.3% | $5.36 billion | Q2 results August 5 |
| Blackstone Secured Lending Fund (NYSE:BXSL) | $23.10 | -0.2% | $5.36 billion | Q2 results August 6 |
| Main Street Capital Corporation NYSE:MAIN | $54.41 | -0.1% | $4.93 billion | Q2 results August 6 |
Friday market data and company reporting schedules.
July payrolls follow Friday at 8:30 a.m. ET. The release may shift rate expectations for floating-rate lenders.
Risks: Nonaccruals rose to 2.4% from 1.8% at year-end. Fitch’s U.S. private-credit default rate reached a record 6.0% in the second quarter. More markdowns or slower backlog conversion could pressure NAV and coverage.
The data suggest investors now price a modest earnings gap, not a dividend break. That view depends on richer new loans arriving before credit costs worsen.
Related articles: Dividends