Artificial IntelligenceEarnings
Marvell Shares Drop 10.3% Amidst Scrutiny Over AI Revenue Margins
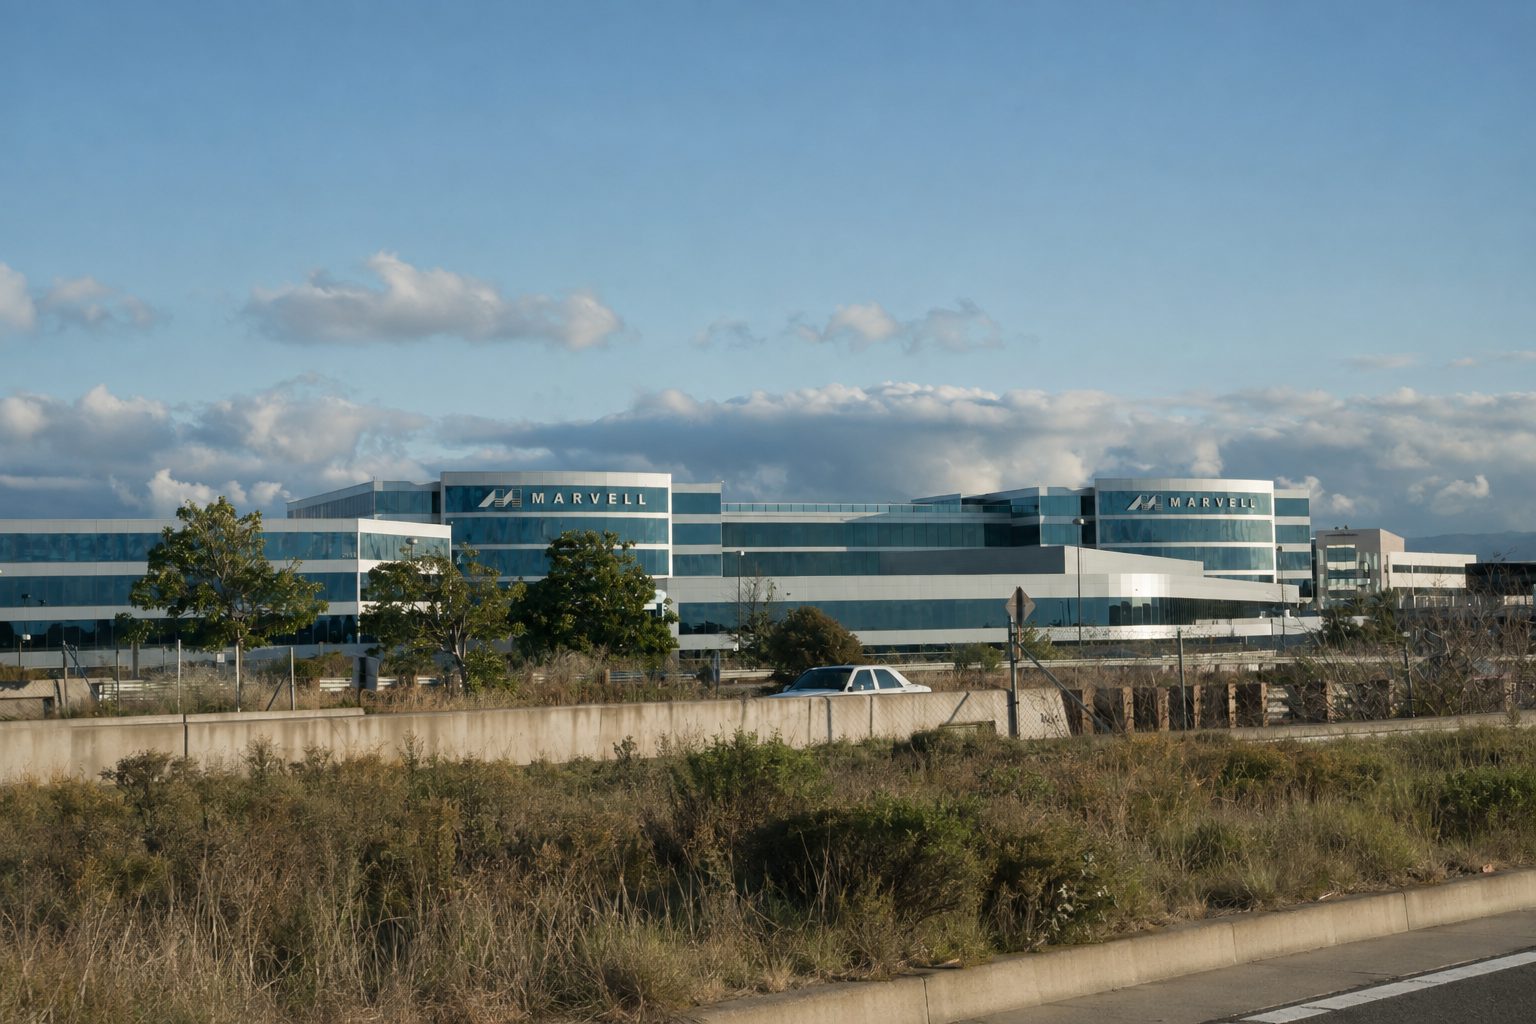
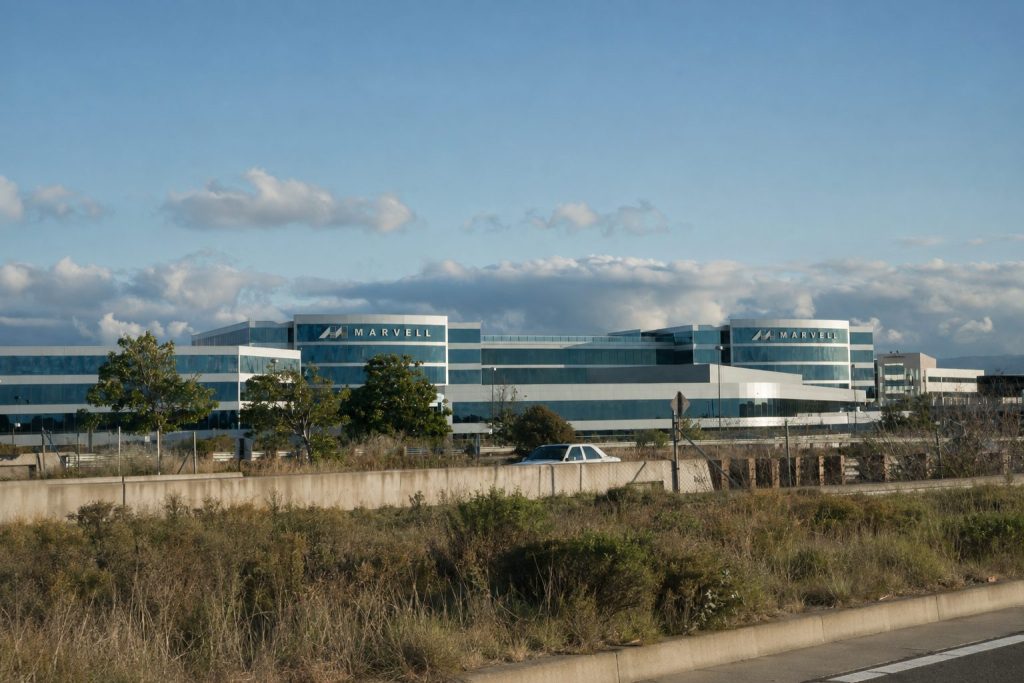
Marvell Technology fell 10.3% on Friday, wiping out approximately $22 billion in market value, after reporting its highest ever quarterly revenue.
Artificial Intelligence
Marvell Technology fell 10.3% on Friday, wiping out approximately $22 billion in market value, after reporting its highest ever quarterly revenue.
All coverage
Marvell Technology fell 10.3% on Friday, wiping out approximately $22 billion in market value, after reporting its highest ever quarterly revenue.
| Measure | Q2 | Q3 guide |
|---|---|---|
| Revenue | $2.739B | $3.150B ±5% |
| Non-GAAP GM | 58.9% | 58.0% midpoint |
| Non-GAAP EPS | $0.94 | $1.10 ±$0.05 |
The growth guide is strong. The 90-basis-point gross-margin step-down and Google revenue timing pushed attention toward execution.
| Metric | MRVL | Reference |
|---|---|---|
| Forward P/E | 58.4× | Broadcom 32.2× |
| Median target | $295 | +36.2% vs close |
| Ratings | 37 Buy/OW | 6 Hold · 0 Sell |
| FY28 revenue target | $18B | 6.6× Q2 run-rate quarter |
| Cash | $3.933B |
| Quarterly operating cash flow | $605.5M |
| Stock-based compensation | $326.2M |
| Q2 GAAP net income | $308.0M |
Google-linked revenue becomes more meaningful in fiscal 2029. Investor Day: Oct. 6, 2026.
NEW YORK, August 28, 2026, 23:10. IREN shares dropped 12.5% after reporting $4 billion in annual recurring revenue from AI, which was accompanied by…
AI Cloud became 51.4% of quarterly revenue. Source: IREN FY26 results, Aug. 27.
Adjusted EBITDA fell 68%; margin contracted to 14.0% from 41.1%.
| Metric | Value | Multiple |
|---|---|---|
| Closing market value | $12.67B | — |
| FY26 GAAP revenue | $707M | 17.9× |
| Operating ARR, Aug. 26 | $1.0B | 12.7× |
| Contracted 2026 ARR | $4.0B | 3.2× |
ARR is non-GAAP and assumes contracted GPUs operate 8,760 hours; recognized revenue may be lower.
| Company | Price | Day |
|---|---|---|
| IREN | $35.45 | −12.6% |
| CoreWeave | $84.23 | −2.9% |
| Nebius | $209.18 | −4.3% |
IREN underperformed both neocloud peers by more than eight percentage points.
| FY26 | Value | YoY |
|---|---|---|
| Total revenue | $707.0M | +41% |
| AI Cloud revenue | $128.8M | +685% |
| Adjusted EBITDA | $245.7M | −9% |
| Net result | −$702.6M | vs +$86.9M |
Net loss included $638.8M of non-cash impairments.
H.C. Wainwright: Buy, $90 target, reiterated Aug. 28.
B. Riley: commercial and financing path validated; execution now moves to commissioning.
Visible Alpha quarterly adjusted-EBITDA consensus was $57.1M versus $19.2M reported.
Horizon 2 commissioning; Horizon 3–4 target Q4 2026.
$1B operating ARR must approach $4B contracted ARR.
$14B of cash, committed financing and prepayments supports rollout.
Delays, customer concentration, GPU pricing, debt and obsolescence.
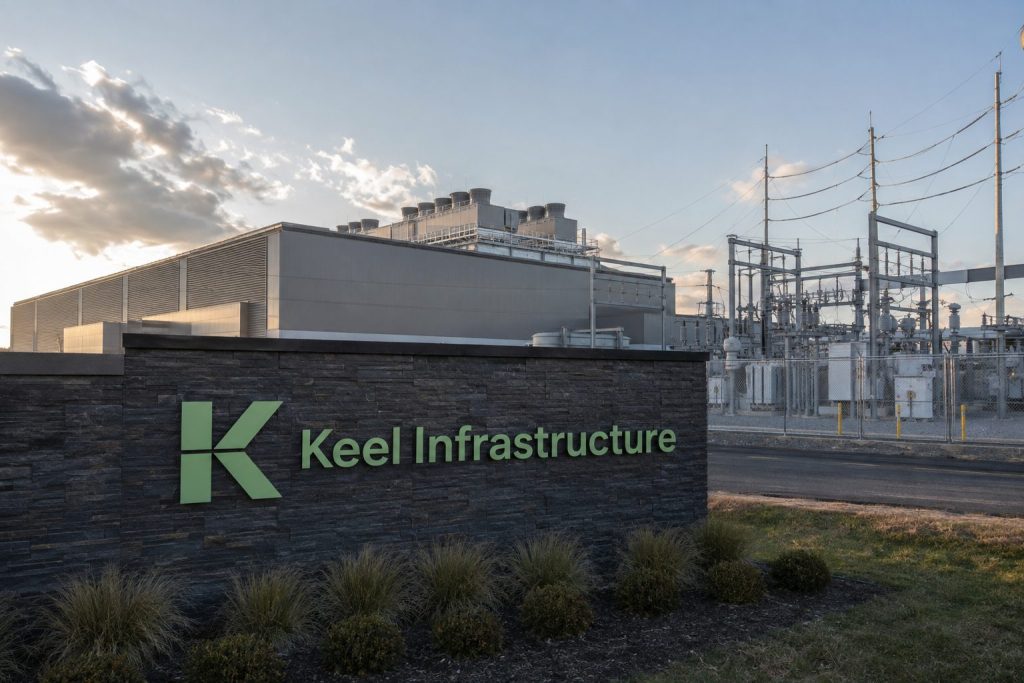
NEW YORK, August 28, 2026, 19:25. Keel Infrastructure shares were down 8% after the company disclosed $819 million in liquidity and confirmed its 2.2-gigawatt…
| Metric | Q2 2026 | Change |
|---|---|---|
| Revenue | $30.4M | -50% |
| Operating result | -$141M | From +$11M |
| Adjusted EBITDA | -$23.7M | From +$6.6M |
| Continuing loss | -$64M | -$0.11/share |
| Milestone | Current state | Signal |
|---|---|---|
| Commercial demand | Negotiations at three sites | Signed lease needed |
| Washington HPC | 18 MW conversion | No HPC revenue yet |
| Funding | $458M convertibles | 1.25%, due 2032 |
| Legacy exit | Mining decommissioned at key sites | Near-term revenue gap |
The valuation case depends on converting powered land into long-duration AI leases before liquidity is consumed. Each 100 MW of signed capacity would materially improve visibility, but economics remain undisclosed.
Core AI Holdings shares jumped about 56% on Friday after quarterly revenue reached $22.35 million. Trading volume exceeded 205 million shares, roughly 388 times…
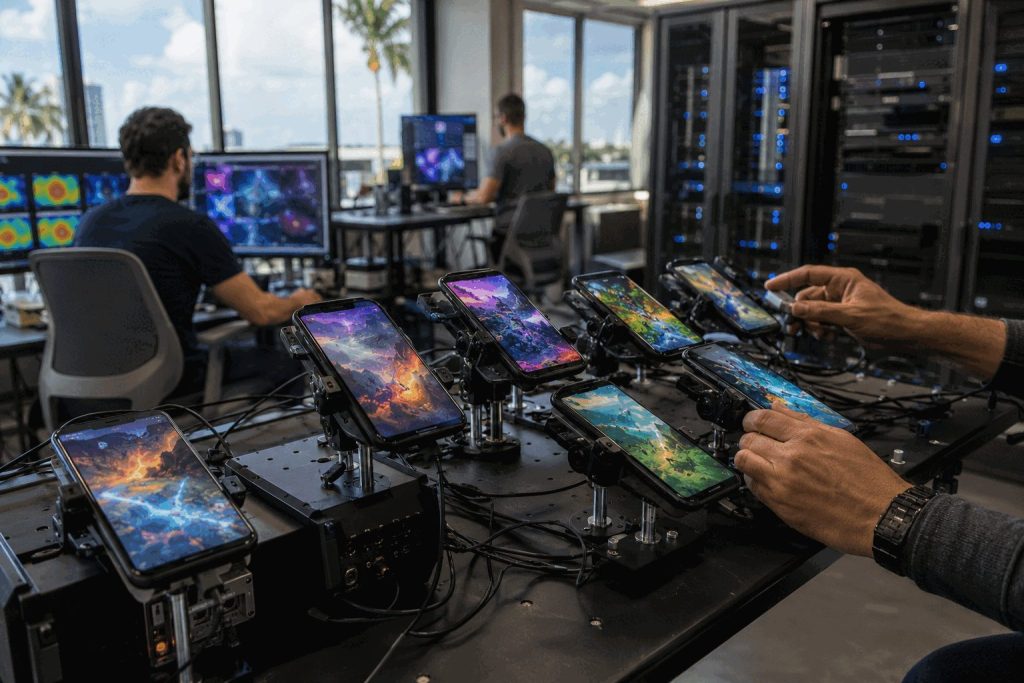
NASDAQ: CHAI · Mobile games and advertising analytics
| Metric | Q2 2026 | Q2 2025 | YoY |
|---|---|---|---|
| Revenue | $22.35m | $14.34m | +55.8% |
| Gross profit/(loss) | ($0.01m) | ($0.40m) | 97.2% narrower |
| Net loss | ($1.62m) | ($0.76m) | +114% |
| H1 revenue | $26.12m | $28.85m | -9.5% |
| H1 operating cash flow | $5.45m | ($2.42m) | Turned positive |
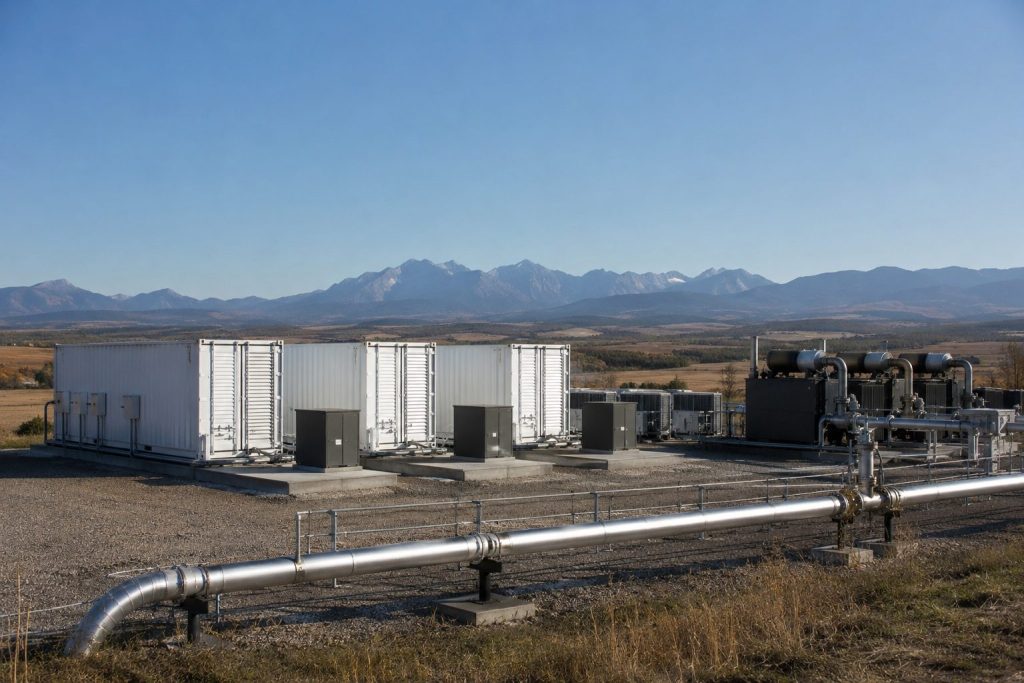
FingerMotion, Inc. shares surged over threefold on Friday, following the announcement of a modular artificial-intelligence data-center plan with BlueFlare Energy Solutions. The move boosted…
The market priced an AI-infrastructure plan before contracts.
| Measure | Figure | Status |
|---|---|---|
| Lyken.AI ownership | 9.9% | Acquired |
| FNGR shares issued | 1,674,480 | Restricted |
| Cash paid | $0 | Equity-funded |
| B300 nodes | 128 | Nonbinding MOU |
The rally values execution that has not occurred. No site, power, customer or project-financing agreement is definitive. The Lyken customer memorandum is nonbinding. Equity consideration dilutes holders, while micro-cap liquidity can reverse quickly.
Illustrative milestone completion: strategy disclosed; four core contractual steps remain.
Sources: FingerMotion announcement and June 8-K; Aug. 28 filing summary; market data at 11:26:07 EDT. Implied prior market cap and value added are calculations from current market cap and the 261.7% price move. Not investment advice.
NEW YORK, August 28, 2026, 11:13 – SharonAI shares slid 4.2% as uncertainty grew over its $4.88 billion deal with Nvidia, following Nvidia's decision…
Reuters reported Nvidia paused some credit-support deals that exchanged financing help for cloud-revenue participation.
Nvidia said the broader compute-access model remains in place and continues to evolve.
| Metric | Value | Signal |
|---|---|---|
| Revenue | $1.93M | +412% YoY |
| Adjusted EBITDA | $0.59M | Positive |
| Net loss | −$430.4M | Mostly non-cash |
| Cash | $1.861B | Build-out buffer |
| Current note liabilities | $1.007B | Financing weight |
| Checkpoint | Why it matters |
|---|---|
| Financing terms | Determines deployment cost and equity dilution |
| GPU acceptance | Triggers capacity availability and revenue |
| Customer utilization | Turns reserved capacity into billed sales |
| Contract amendments | Tests whether Nvidia's pause reaches SharonAI |
| Cash burn | Measures runway during infrastructure ramp |
The stock move values implementation risk, not simply demand. SharonAI's SEC filing already says deployments need additional debt or equity financing and face phased acceptance tests.
Key question: can $8.8 billion of contracted value convert into revenue without costly new capital?
Workday Inc. stock climbed 2.9% on Friday, lifting its market capitalization by roughly $1.4 billion following quarterly results that indicated notable demand for AI…
At $199.26, the stock sits near Citi’s target. The range shows disagreement over whether AI demand can offset slower subscription growth and weaker cash conversion.
Bull case: AI is already attached to customer wins, subscription backlog growth exceeds total backlog growth, and a $4 billion authorization can support per-share results.
Bear case: Q3 subscription growth slows to 12%, free cash flow contracted, trailing P/E remains about 40×, and takeover reports remain unconfirmed.
IREN Limited shares declined by 5.75% ahead of the market open on Friday, cutting approximately $833 million from its implied equity valuation.
FY2026 results and premarket reset · Market data at 07:14 EDT, August 28, 2026
ARR is a non-GAAP operating metric. IREN warns recognized revenue may be materially lower. Commissioning and customer acceptance govern conversion.
| US$ millions | Q4 | Q3 | Change |
|---|---|---|---|
| Total revenue | 137.2 | 144.8 | −5.2% |
| AI Cloud | 70.5 | 33.6 | +109.8% |
| Bitcoin mining | 66.7 | 111.2 | −40.0% |
| Adjusted EBITDA | 19.2 | 59.5 | −67.7% |
| Net loss | (684.0) | (247.8) | Wider |
Quarter-end cash and restricted cash: $7.62B.
Q4 operating cash flow: $1.81B, including a $1.72B increase in deferred revenue.
Deferred revenue supports cash flow before revenue recognition. It also creates delivery obligations.
The market is weighing a fast mix shift against its accounting cost. AI Cloud more than doubled sequentially, but adjusted EBITDA fell 68% and the quarter carried a $450.4M mining-hardware impairment.
The key question is no longer demand alone. It is how quickly contracted ARR becomes recognized revenue without further impairments, delays or financing strain.
52-week range
$25.31–$76.87
Short interest
30.61% of float
Three-month return
−36.21%
One-year return
+53.06%
| 2026 IT capacity target | 0.3 GW |
| 2027 IT capacity target | 0.8 GW |
| Horizon 1 | Accepted by Microsoft |
| Recent contract economics | >$20M revenue/MW |
| Claimed payback | ~2 years |
Commissioning delaysCustomer concentrationGPU supplyHardware obsolescenceDebt costBitcoin exposure
The $4B contracted ARR figure is not recognized revenue. Timing, utilization, uptime and customer acceptance remain decisive.
Sources: IREN FY2026 results; MarketWatch quote and ownership data; Investors.com market report. Financial figures in U.S. dollars. Calculations may differ due to rounding.
SANTA CLARA, California, August 28, 2026, 07:21 — Marvell Technology fell 6.9% as investors reacted to Google's adjusted forecast, placing significant AI-related revenue gains…
Management lifted fiscal 2027 guidance by about $500 million and fiscal 2028 guidance by about $1.5 billion.
| Metric | Q2 FY27 | Signal |
|---|---|---|
| Revenue | $2.739B | +37% |
| Adjusted EPS | $0.94 | $0.93 est. |
| GAAP net income | $308M | +58% |
| Operating cash flow | $605.5M | 22.1% margin |
| Non-GAAP gross margin | 58.9% | Profitable scale |
| Signal | Current view | Investor meaning |
|---|---|---|
| Q3 revenue | $3.15B ±5% | More than 50% growth implied |
| Q3 adjusted EPS | $1.10 ±$0.05 | Above Q2 run-rate |
| Google contribution | Some through FY28 | Larger in FY29 |
| Investor Day | Oct. 6, 2026 | Next major detail point |
The median target offers roughly 22% upside from premarket. Forward P/E is 58.4×, versus 32.2× for Broadcom.
Salesforce Inc. rose 22.6% on Thursday, as improved contract growth and increased cash flow boosted investor faith in its AI approach.
AI monetization accelerates; valuation catches up quickly.
| Metric | Value | Growth |
|---|---|---|
| Revenue | $11.35B | +11% |
| cRPO | $33.5B | +14% |
| Agentforce + Data 360 ARR | ≈$3.9B | >+210% |
| Free cash flow | $1.1B | +81% |
| GAAP operating margin | 20.5% | — |
Updated FY2027 revenue range: $46.1B–$46.4B. Contentful and Fin remain pending.
| Rating | Count | Share |
|---|---|---|
| Buy | 29 | |
| Hold | 9 | |
| Sell | 1 |
39 analysts; targets range from $160 to $400. Data viewed Aug. 28, 2026.
| Signal | Bull case | Risk case |
|---|---|---|
| AI monetization | ARR sustains triple-digit growth | Usage fails to lift core growth |
| Guidance quality | Organic raise expands | Acquisitions carry the increase |
| Valuation | Targets move higher | Close already nears consensus |
| Margins | Cash growth stays ahead of sales | Integration costs pressure leverage |
Sources: Salesforce Q2 FY2027 release; Public/Xignite closing data; Google Finance analyst data; Reuters. Prices as of Aug. 27 close. Not investment advice.
Intel Corporation rose 4.36% on Thursday as Nvidia's forecast revived confidence in AI infrastructure spending.
Nvidia's forecast lifted Intel 4.36%; the close remains below Intel's recent $95 share-sale price.
| Company | Close | Move | Volume | Trailing P/E |
|---|---|---|---|---|
| Intel | $92.09 | +4.36% | 100.56M | N/M |
| Nvidia | $227.98 | +8.72% | 298.91M | 28.6× |
| AMD | $476.67 | −0.86% | 16.44M | 122.5× |
| Micron | $935.39 | −0.36% | 28.84M | 21.2× |
The split tape matters: Thursday rewarded Intel's AI exposure, but the whole semiconductor group did not rally.
| Q2 revenue | $16.1B | +25% |
| GAAP gross margin | 40.4% | +12.9 pts |
| GAAP operating margin | 11.1% | +35.8 pts |
| Non-GAAP net income | $2.2B | vs. loss |
| GAAP net result | −$11.0B | loss |
Revenue and margins rose sharply, but the GAAP loss kept earnings quality in focus.
Intel sold 210.5 million shares at $95, creating a clear dilution and execution benchmark.
Nvidia's forecast lifted Intel, yet no new Intel design win was announced.
Intel's 4.36% gain says the market sees value in its exposure to expanding AI budgets. The harder test is conversion: foundry utilization, server share, margin durability and cash generation must justify both a $470 billion valuation and the new capital raised at $95.
Shares of IREN Limited dropped 5.97% in after-hours trading on Thursday. Despite strong expansion in AI Cloud, the costs from infrastructure transition and associated…
| Operating ARR | $1.0B |
| Contracted 2026 ARR | $4.0B |
| 2026 IT capacity | ~0.3GW |
| 2027 IT capacity target | ~0.8GW |
| Recent revenue / MW | >$20M |
| Customer prepayments | 45–55% GPU capex |
| Metric | FY25 | FY26 | Change |
|---|---|---|---|
| Total revenue | $501.0M | $707.0M | +41.1% |
| AI Cloud revenue | $16.4M | $128.8M | +685% |
| Adjusted EBITDA | $269.7M | $245.7M | -8.9% |
| Net income/(loss) | $86.9M | -$702.6M | NM |
| Regular close | $40.53 |
| After-hours | $38.11 |
| Implied value change | ~-$865M |
| 52-week range | $22.63–$76.87 |
| Ratings | 7 Buy / 2 Hold / 1 Sell |
| Average target | $77.44 |
Watch: quarterly adjusted EBITDA fell 67.7% sequentially as staffing and platform costs arrived before the revenue ramp. Deferred revenue drove $1.722 billion of quarterly operating cash flow.
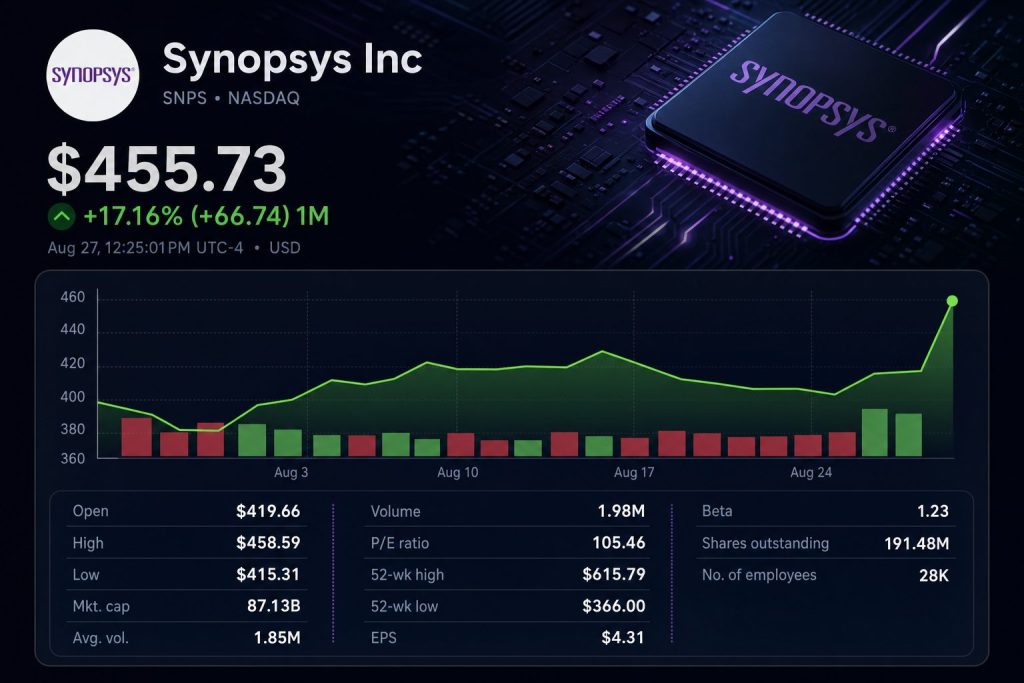
Shares of Synopsys climbed 10.7% as increased demand for chip design enabled the software firm to boost its yearly guidance. The stock was last…
| Measure | FY2026 / Q4 range |
|---|---|
| FY revenue | $9.69B-$9.74B |
| FY adjusted EPS | $15.04-$15.10 |
| Q4 revenue | $2.53B-$2.58B |
| Q4 adjusted EPS | $4.10-$4.16 |
| FY operating cash flow | About $2.8B |
| FY free cash flow | About $2.6B |
| Signal | Current reading | What to watch |
|---|---|---|
| Cash + short-term investments | $3.608B | Integration flexibility |
| Outstanding debt | $10.037B | Debt paydown pace |
| Recurring revenue | 82% | Renewal quality and pricing |
| Q3 operating cash flow | $813M | Conversion into free cash flow |
SANTA CLARA, California, August 27, 2026, 10:37 EDT — ServiceNow's stock soared 9%, translating to an added $11.7 billion in market value as Salesforce's…
Salesforce market data at 10:28 EDT; operating metrics released Aug. 26.
| Company | Price | Move |
|---|---|---|
| ServiceNow (NOW) | $137.16 | +9.03% |
| Salesforce (CRM) | $248.29 | +20.75% |
| Workday (WDAY) | $197.39 | +3.48% |
| Oracle (ORCL) | $150.84 | +1.32% |
NOW at 10:37 EDT; peer prices at about 10:28 EDT on Aug. 27, 2026.
2:40 p.m. EDT today
ServiceNow CFO Gina Mastantuono speaks at Deutsche Bank's technology conference.
Next quarter
Watch whether cRPO holds near 20% constant-currency growth and AI ACV converts into subscriptions.
Risk
The rally is a peer read-through. Average target upside is now only 3.7%.
The U.S. search phrase “now stock” also points to ServiceNow's expanded Tech Mahindra partnership. It was announced Aug. 20, not today. Tech Mahindra says its ServiceNow deployment handles more than 100,000 monthly cases across 90 countries, supports 150,000 employees and has optimized about 25% of first-level support work.
Volato Group, Inc. jumped 55.31% on Wednesday as the firm announced a merger with Alignment Engine. The private AI-infrastructure company was valued at about…
| Metric | Figure | Signal |
|---|---|---|
| Q2 revenue | $0.965M | Small base |
| Q2 net loss | −$2.051M | Loss exceeds revenue |
| Cash | $8.440M | June 30 |
| H1 operating cash use | −$2.855M | Funding need remains |
| H1 financing cash | +$6.953M | Mostly equity-linked |
| Analyst consensus | None | Zero current ratings |
| Ownership | Undisclosed conversion economics can dilute common holders. |
| Funding | Campus buildout costs and capital sources remain undisclosed. |
| Commercial proof | No campus customers, revenue or contracted backlog were reported. |
| Execution | The path from 154 MW to 480 MW needs permits, equipment and financing. |
| Liquidity | Extreme turnover and the premarket reversal imply high volatility. |
Shares of Salesforce surged 10.99% to $228.63 during Thursday's premarket session, after the company reported better-than-expected fiscal second-quarter earnings and raised its full-year forecast.…
| Metric | Q2 FY27 | Year earlier | Change |
|---|---|---|---|
| Revenue | $11.345B | $10.236B | +10.8% |
| Current RPO | $33.5B | ≈$29.4B | +14% |
| Free cash flow | $1.098B | $0.605B | +81% |
| GAAP operating margin | 20.5% | 22.8% | −230 bp |
| Diluted share count | 821M | 962M | −14.7% |
| Revenue | $46.1B–$46.4B |
| Revenue growth | 11%–12% |
| Non-GAAP margin | 34.3% |
| Free-cash-flow growth | 4%–5% |
| Non-GAAP EPS | $16.67–$16.71 |
The target implies about 6% upside from $228.63. Premarket trading has already captured most of the pre-result consensus gap.
Now: Earnings beat, 14% cRPO growth and nearly $3.9B of AI-and-data ARR.
Next: Contentful and Fin closings, Q3 cRPO delivery and October ASR settlement.
Acquisitions contribute $200M of the $200M reported guidance raise; organic growth contributes $100M while FX subtracts $100M.
GAAP margin fell 230 basis points. Strategic investments supplied $2.53 of adjusted Q2 EPS.