New York, August 31, 2026, 04:30 - Nokia stock dropped 3.6% as the company's €732 million cash burn put added pressure on the telecom equipment maker's efforts to grow in AI and cloud, putting…
UiPath Inc. heads into earnings week with a high level of short interest and expectations for a strong rebound priced into the stock. Shares…
·3 min read
NYSE: PATH · Stock move
UiPath earnings pressure map
A 39% monthly rally meets high short interest and a slower sequential ARR build.
Market: Aug. 28, 2026, 16:00 EDT Prepared: Aug. 31, 2026, 00:10 EDT
Friday close
$18.15
−0.98% · −$0.18
Volume
53.13M
79% of 65-day average
Short interest
29.27%
117.88M shares
One-month move
+39.08%
Five-day gain: +9.54%
Operating benchmarks
Metric
Q1 FY2027
Next test
Revenue
$418M · +17% YoY
$395M–$400M Q2 guide
ARR
$1.901B · +12%
$1.929B–$1.934B
Net new ARR
$49M
≈$30.5M implied midpoint
Net retention
109%
Stabilization or reacceleration
GAAP operating income
$28M
Profit durability
Adjusted free cash flow
$130M
Cash conversion
Positioning gauge
High short interest can accelerate covering on a beat or deepen a reversal after a miss.
Market value
$9.4B
P/E: 29.95×
Cash + securities
$1.42B
15% of equity value
Implied EV / ARR
≈4.1×
Using Q2 ARR midpoint
52-week range
$9.20–$19.84
Close is 8.5% below high
Catalyst calendar
Sep. 3
Q2 FY2027 results After close; call at 5:00 p.m. EDT.
Sep. 22
Investor Day 2026 11:30 a.m. PDT; strategy and long-term model.
FY2027
Full-year guide Revenue $1.776B–$1.781B; non-GAAP operating income ≈$430M.
What can break the setup
ARR growth below 12%, net retention slipping from 109%, weaker federal or international demand, and poor conversion of agentic pilots into production contracts would challenge the rerating.
Banco Azteca provides operating proof: 300+ automations across 8,800+ processes. It does not disclose UiPath contract value.
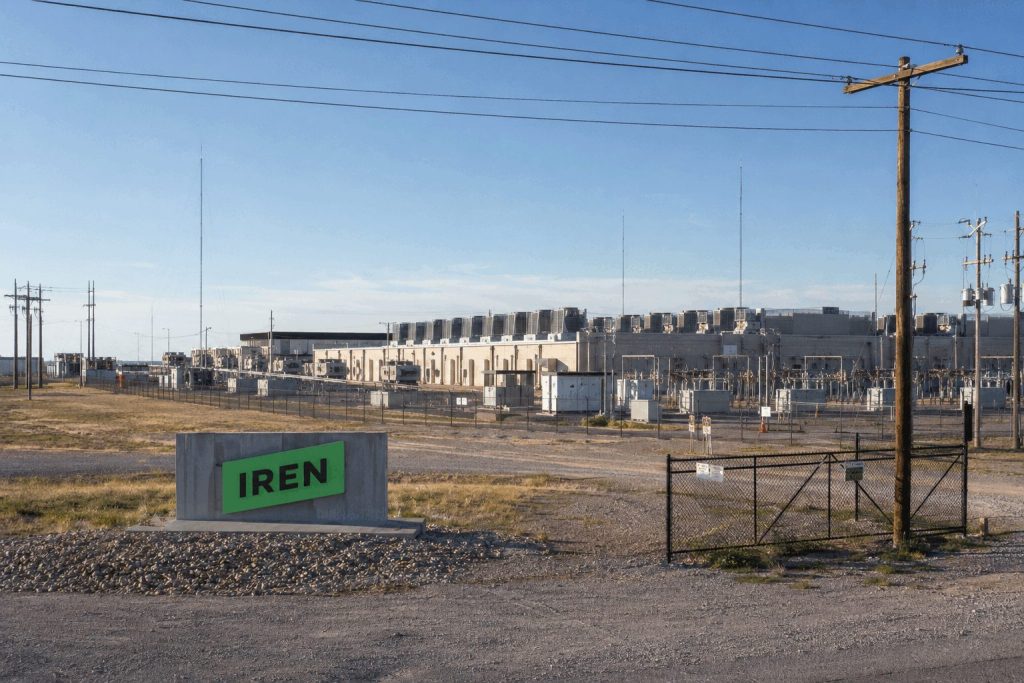
IREN Limited fell 12.53% on Friday after annual results highlighted the expense of turning contracted AI demand into operating cash flow. Shares settled at…
HALLANDALE BEACH, Florida, August 30, 2026, 15:10 EDT – Shares in Marathon Digital Holdings dropped 10.1%, erasing $458 million in market value, after the…
·2 min read
MARA · Nasdaq · Stock move
Bitcoin beta meets an infrastructure funding test
Market: Aug. 28, 2026, 16:00 EDT Financials: Q2 ended June 30, 2026
Friday close$10.67-10.11%
Equity value erased~$458Msession estimate
Volume41.93M90% of 65-day average
Q2 revenue$174.9M-26.7% YoY
Q2 net loss$611.3MBitcoin markdown included
Operating scale rose; financial output fell
Energized hash rate
+22%
Bitcoin production
+3%
Revenue
-26.7%
Higher compute output did not offset weaker Bitcoin economics and fair-value volatility.
Balance-sheet sensitivity
Cash + Bitcoin
$2.5B
Pledged / loaned
26%
Current market cap
$4.07B
Gross liquid-assets / cap
61%
Gross holdings are not net asset value; collateral, debt, taxes and operating needs matter.
Long Ridge pivot
Item
Value
Purchase price
$1.5B
Assumed debt
$785M
Annualized adjusted earnings
~$144M
Purchase / earnings
~10.4×
Analyst expectations
Consensus
Overweight
Average target
$18.00
Implied upside
68.7%
Target range
$6–$30
FY2026 EPS estimate
-$4.56
Investor bridge: Friday's fall removed about $458 million of equity value. The $2.5 billion cash-and-Bitcoin pool supports optionality, but 26% is pledged. Long Ridge must turn power assets into contracted, recurring infrastructure cash flow before MARA earns a steadier valuation.
Marvell Technology Inc. shares slid 10.28% on Friday, wiping out close to $22.4 billion in implied equity value.
·3 min read
Marvell Technology — Investor Dashboard
Record AI demand meets a delayed revenue bridge
Market data: Aug. 28, 2026, 16:00 EDT Dashboard: Aug. 30, 2026, 09:42 EDT
MRVL close
$216.62
−10.28% Friday
Value erased
≈$22.4B
Using ~900M guided shares
Volume
48.98M
121% of 65-day average
After-hours
$216.40
−0.10% at 19:59 EDT
Q2 revenue
$2.739B
+37% year over year
Data center
$2.17B
+46%; 79% of sales
Q3 guide
$3.15B
±5%; EPS $1.10 ±$0.05
Cash generation
$605.5M
Q2 operating cash flow
Revenue scale and mix
Q2 total
$2.739B
Data center
$2.17B
Q3 midpoint
$3.15B
FY27 target
$12.0B
FY28 target
$18.0B
Valuation and expectations
Measure
Reading
Signal
FY2027 EPS estimate
$4.20
51.6× P/E
FY2028 EPS estimate
$6.69
32.4× P/E
Average target
$291.26
34.5% upside
Median target
$295.00
36.2% upside
Rating mix
37 Buy/Overweight
6 Hold, 0 Sell
What changed
Catalyst timeline
Oct. 6, 2026Investor Day: program milestones and long-range targets
Nov. 26, 2026Expected Q3 earnings checkpoint
FY2028Company revenue target near $18B
FY2029Meaningful Google custom-chip revenue expected
Investor read-through
Marvell’s current AI business is accelerating, but the market is discounting a longer bridge to Google revenue. The stock can recover if near-term custom compute and interconnect growth preserve the $18 billion fiscal 2028 target without sacrificing gross margin.
Key risks: customer concentration, Google schedule slippage, a 51.6× fiscal 2027 earnings multiple, and integration of Celestial AI and XConn.
Sources: Marvell Q2 FY2027 release; Reuters, Aug. 28, 2026; WSJ/FactSet market data and research ratings; SEC filings. Estimates are not company guarantees.
NEW YORK, August 30, 2026, 08:16 — Shares of IREN declined by 12.5% after the company unveiled $4 billion in new AI contracts at…
·3 min read
IREN · Nasdaq: IREN · Stock move
AI revenue crossed mining. The cash-flow bridge still matters.
Market data: August 28, 2026, 16:00 EDT · Dashboard updated August 30, 2026, 08:18 EDT
Friday close
$35.45
−12.53%
Volume
88.62m
1.95× 3-month average
Market value
$12.67bn
≈$1.8bn erased Friday
Q4 AI Cloud revenue
$70.5m
+110% quarter on quarter
Quarterly revenue mix changed hands
AI Cloud overtook mining for the first time. Mining revenue fell 40% sequentially as hardware was retired.
What moved the shares
The quarter proved demand but weakened near-term earnings. Adjusted EBITDA dropped 68% sequentially to $19.2m. Net loss reached $684.0m, including a $450.4m non-cash impairment.
AI mix improvedEBITDA compressedMining exit accelerated
Annual financial bridge
US$ millions
FY2025
FY2026
Change
Total revenue
501.0
707.0
+41%
AI Cloud revenue
16.4
128.8
≈8×
Adjusted EBITDA
269.7
245.7
−9%
Net income / loss
86.9
−702.6
−789.5
Non-cash impairments
—
638.8
Transition cost
Contracted capacity versus valuation
Contracted 2026 ARR$4.0bn
Operating ARR today$1.0bn
Market value / contracted ARR: about 3.2×. Market value / FY2026 revenue: about 17.9×. ARR is non-GAAP and may convert into recognized revenue more slowly.
Funding stack and delivery
Microsoft GPU financing
$3.6bn
6.0%
New GPU facilities
$2.8bn
9.0%
Cash + commitments + prepayments
$14bn
Customer prepayments
45%–55% of related GPU capex
Operational power
810 MW
Under construction
2.1 GW
Secured pipeline
>5 GW
Next confirmed milestones
Horizon 2: commissioning underway.
Horizon 3–4: delivery targeted in Q4 2026.
Microsoft: first 50 MW liquid-cooled deployment delivered in August.
2027: company targets cumulative delivery of about 0.8 GW IT load.
Peer tape
Company
Close
Friday move
Volume
Market value
IREN
$35.45
−12.53%
88.62m
$12.67bn
CoreWeave
$84.23
−2.94%
17.33m
$46.41bn
MARA Holdings
$10.67
−10.15%
41.93m
$4.07bn
IREN underperformed both peers, pointing to company-specific concern about transition timing and earnings quality.
Analyst read-through
B. Riley: Nick Giles viewed the quarter as validating IREN's commercial and financing path.
H.C. Wainwright: Buy rating retained; $90 target. That target is roughly 154% above Friday's close.
Named recommendations reported August 28, 2026. They are not a full consensus.
Risk monitor
ARR conversion may lag. Large contracts create customer and counterparty concentration. Construction slippage, 6%–9% debt costs and more mining write-downs could delay free cash flow.
Upside sensitivities: faster commissioning, higher GPU utilization and managed-services revenue.
Sources: IREN FY2026 results and company operating data; Yahoo Finance Most Active; market quotes captured August 28, 2026. Figures rounded. This dashboard distinguishes contracted ARR from GAAP revenue.
NVIDIA Corporation fell 4.57% to $217.55 on Friday. The decline erased about $251 billion of equity value, based on 24.1 billion shares outstanding.
·2 min read
NVIDIA · NASDAQ: NVDA
Growth survives. Margin tolerance narrows.
The $108 billion revenue guide supports demand, while Friday's reversal prices execution risk.
Equity data: Aug. 28, 2026 · 16:00 EDT Dashboard updated: Aug. 30, 2026 · 07:12 EDT
Friday close
$217.55
−4.57% · −$10.43
Market value erased
≈$251B
Friday · 24.1B shares
Trading activity
195.1M
1.37× 65-day average
Two-day earnings move
≈+3.7%
Wednesday close to Friday close
Quarterly bridge
RevenueGross margin midpoint
Operating signals
Measure
Q2 FY2027
Comparison
Investor reading
Revenue
$96.2B
+106% YoY
Demand remains exceptional
Data Center
$89.0B
92.5% of revenue
Concentration amplifies infrastructure-cycle risk
GAAP operating income
$63.7B
+124% YoY
Scale still outpaces expense growth
Accounts receivable
$63.1B
$38.5B in January
Working-capital exposure is rising
Inventory
$31.6B
$21.4B in January
Supply preparation raises execution stakes
Capital returned
$26.0B
$99.0B authorization left
Supportive, but small versus market value
What the market is pricing
The Friday selloff erased more than two and a half quarters of current revenue in market value. Yet the stock remained above its pre-earnings level. Investors accepted the demand case but demanded cleaner proof that supply, China exposure and gross margin can support it.
Key risks and next checkpoint
Supply
Memory shortages could cap shipments despite firm orders.
China
Q3 guidance assumes no Data Center compute revenue from China.
Valuation
A 12.1× annualized sales multiple leaves little room for delayed spending.
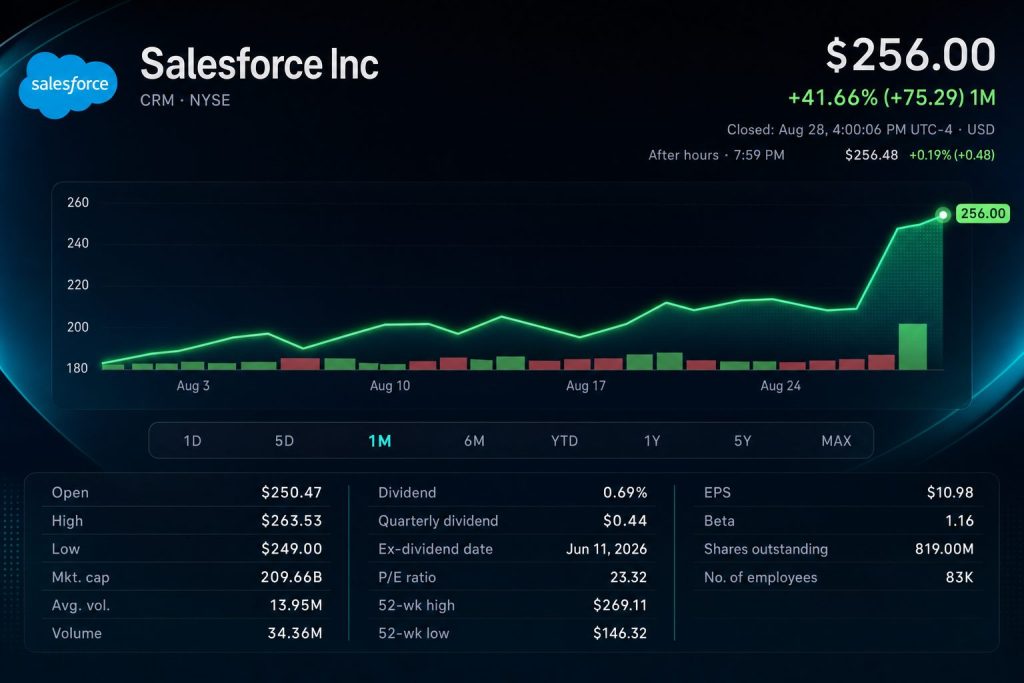
Salesforce Inc. advanced 1.6% on Friday. Volume hit 34.4 million shares, roughly 2.3 times the stock's recent average. Shares ended the session at $256.00,…
·3 min read
NYSE: CRM · Investor dashboard
Salesforce: AI momentum meets a tighter valuation ceiling
Updated August 30, 2026, 00:18 EDT Market data: August 28 close
Close
$256.00
Aug. 28, 16:00 EDT
Daily move
+1.56%
After +22.6% Thursday
Volume
34.36M
2.29× recent average
Market value
$210.2B
Aug. 28 close
What the quarter changed
Reported company growthForward demand and AI indicators
Guidance and quality
FY27 revenue$46.1B–$46.4B
Growth11%–12%
Non-GAAP margin34.3%
Adjusted EPS$16.67–$16.71
cRPO$33.5B · +14%
Peer valuation and Friday performance
Company
Close
Move
Market cap
P/E
Salesforce
$256.00
+1.6%
$210.2B
23.5×
ServiceNow
$144.71
+4.5%
$149.7B
89.3×
Workday
$204.72
+5.6%
$50.4B
41.4×
Adobe
$291.52
+0.8%
$117.3B
16.7×
Investor bridge
Agentforce and Data 360 ARR approached $3.9 billion and grew more than 210%. Yet Informatica supplied $456 million and more than four points of quarterly revenue growth. The next leg depends on converting AI usage into organic subscription expansion.
Risks
The headline adjusted EPS included a $2.53-per-share investment gain. Informatica complicates organic comparisons. Investment values can reverse, while slower Agentforce monetization could compress a multiple that now sits close to the average analyst target.
Sources: Salesforce FY27 Q2 results and SEC exhibit; Reuters, Aug. 26, 2026; U.S. market closes and valuation data, Aug. 28, 2026; MarketBeat analyst consensus, accessed Aug. 30, 2026. Adjusted and GAAP figures are not interchangeable.
SYDNEY, August 29, 2026, 14:00. IREN shares dropped 12.5% after the company’s $30 billion capital expenditure raised concerns in light of its $4 billion…
·3 min read
IREN · NASDAQ:IREN
AI cloud ramp versus funding burden
Stock data: Aug. 28, 2026, 16:00 EDT Dashboard checked: Aug. 29, 2026, 14:00 EDT
Friday close
$35.45
▼ 12.53%
Friday volume
89.3M
Yahoo Most Active rank 5
Market value
≈$14.0B
≈$2.0B erased Friday
Analyst target
$78.19
+120.6% implied upside
Quarterly pivot
Metric
Q4 FY26
AI cloud revenue
$70.5M · +110% QoQ
Bitcoin mining revenue
$66.7M
Total revenue
$137.2M · −5% QoQ
Adjusted EBITDA
$19.2M · −68% QoQ
Net loss
−$684.0M
Full-year transition
Metric
FY26
AI cloud revenue
$128.8M vs $16.4M
Bitcoin mining revenue
$578.2M
Total revenue
$707.0M
Adjusted EBITDA margin
35% vs 54%
Non-cash impairments
$638.8M
Capital stack
Execution checklist
$4B contracted annualized AI revenue Only about $1B operational at the reporting point
Amazon shares jumped 3.97% on Friday, adding roughly $110 billion of market value. Investors rewarded its AI exposure even as that buildout consumed more…
·2 min read
NASDAQ: AMZN · AI capex versus cash flow
Amazon’s $110 billion rally raises the cash-return bar
Market close: Aug. 28, 2026 · 16:00 EDT Checked: Aug. 29, 2026 · 11:54 EDT
Close
$266.43
+3.97%
After-hours: $266.15
Value added
~$110B
One session
$10.17 × 10.79B shares
Volume
49.55M
101% of average
Day range: $257.78–$267.56
Valuation
21.4×
Trailing earnings
Market cap: $2.87T
Friday megacap tape
Amazon outperformed the Nasdaq Composite by 4.49 percentage points.
Catalyst
Fed Chair Kevin Warsh said AI growth had exceeded even proponents’ expectations. Amazon led the Magnificent Seven after the remarks.
The move also followed fresh bullish analyst commentary and renewed attention to AWS infrastructure demand.
There was no new Amazon earnings release Friday.
Q2 operating engine
Measure
Q2 2026
Total sales
$200.6B · +20%
Operating income
$27.5B · +43%
AWS sales
$42.2B · +37%
AWS operating income
$16.6B
AWS operating margin
39.3%
AWS share of operating profit
60.4%
Cash-flow tension
Trailing operating cash flow
$161.4B · up 33%
Trailing free cash flow
−$7.6B · versus +$18.2B one year earlier
Property and equipment purchases increased by $66.1B, primarily for AI.
Profit quality
Reported net income
$62.6B
Non-operating other income
$53.4B
Main driver
Anthropic investment
Q3 operating-income guide
$22.5B–$26.5B
The guide midpoint is about 11% below Q2 operating income. Reported EPS should not be read as recurring operating profit.
Targets were checked Aug. 29, 2026. They can lag capex revisions and market-rate changes.
What investors should watch
Signal
Constructive
Warning
AWS growth
Stays near 37%
Capacity arrives before demand
Free cash flow
Returns positive
Outflow deepens beyond −$7.6B
AWS margin
Holds near 39%
Power and depreciation compress it
Q3 operating income
Above $26.5B
Below $22.5B
Bottom line
Amazon’s AI businesses are scaling fast enough to command a premium. The stock’s next leg depends on converting infrastructure spending back into free cash flow.
Risks: slower AI utilization, higher rates, energy constraints, depreciation and retail-cost inflation. Faster Trainium adoption or stronger AWS margins would improve the upside case.
A U.S. judge permanently blocked the Pentagon's designation of Anthropic as a supply-chain risk. The ruling removes a major procurement threat as the private…
·2 min read
OTHER TREND · Anthropic v. Pentagon
Blacklist removed; procurement risk narrows
Federal ruling · August 28, 2026
14:45 PDT Court and company data snapshot
Contract at dispute
$200M
military AI award
Private valuation
$380B
February 2026
Funding round
$30B
Series G
Court result
Blocked
permanently
Decision map
Question
Result
Supply-chain designation
Unlawful, arbitrary
First Amendment
Retaliation found
Fifth Amendment
Due process denied
Government remedy
Rescind label and notices
Pentagon vendor choice
Still discretionary
Investor bridge
The $200 million contract is small relative to valuation. The material channel is distribution: a supply-chain label could have reached contractors, civilian agencies and enterprise partners.
Government accessEnterprise trustIPO riskModel policy
Transmission
Court rescinds blacklist
→
Partner eligibility improves
→
Revenue tail risk falls
→
Private valuation support
Watch: government appeal, the separate Washington case, Pentagon vendor substitutions and any revised federal AI-use terms.
Sources: Reuters and Associated Press ruling reports; public court record; EFF contract background. Figures current August 28, 2026, 14:45 PDT.
Nokia Oyj slipped 3.59% on Friday, wiping out roughly $2.1 billion in market capitalization. The stock ended the session at $10.21, breaking a three-day…
·3 min read
Nokia Oyj · NYSE: NOK
AI orders versus the cash-flow test
Market data: Aug. 28, 2026, 4:00 p.m. ET Fundamentals and consensus: Aug. 29, 2026, 3:00 a.m. ET
Close
$10.21
−3.59% Friday
Volume
50.6M
58% of 50-day average
Estimated value lost
$2.1B
Friday session
Analyst target
$15.02
47% implied upside
Order conversion bridge
Orders equal 58% of Q2 sales; management expects roughly half to convert within 12 months.
Profit quality
Comparable operating profit
€434M
+18% YoY
Comparable operating margin
9.0%
+70 bps
Reported operating result
−€50M
€390M restructuring charge
Free cash flow
−€732M
Q2 2026
Net cash
€2.78B
−€1.01B QoQ
Growth and valuation snapshot
Metric
Latest
Comparison
Investor read-through
Group sales
€4.82B
+9% constant currency
Broad growth returned
Network Infrastructure sales
€2.04B
+12% constant currency
Optical and IP led
AI & Cloud sales
€446M
+105% constant currency
9.3% of group sales
2026 comparable operating profit
€2.1B–€2.6B
Midpoint €2.35B
Orders equal 1.19× midpoint
Analyst mix
8 Buy / 2 Hold / 1 Sell
Targets $8.50–$21
Wide execution range
Friday peer tape
Company
Ticker
Move
Nokia
NOK
−3.59%
BlackBerry
BB
−5.66%
Motorola Solutions
MSI
−0.11%
Apple
AAPL
+1.63%
What changes the thesis
Oct. 22, 2026 Confirmed Q3 reporting date.
Upside: Faster order conversion, sustained Optical/IP growth and positive free cash flow.
Downside: Supply delays, continued restructuring outflows, customer concentration or currency pressure.
Sources: Nokia Q2 2026 earnings release and IR calendar; MarketWatch close and volume; Investing.com analyst consensus.