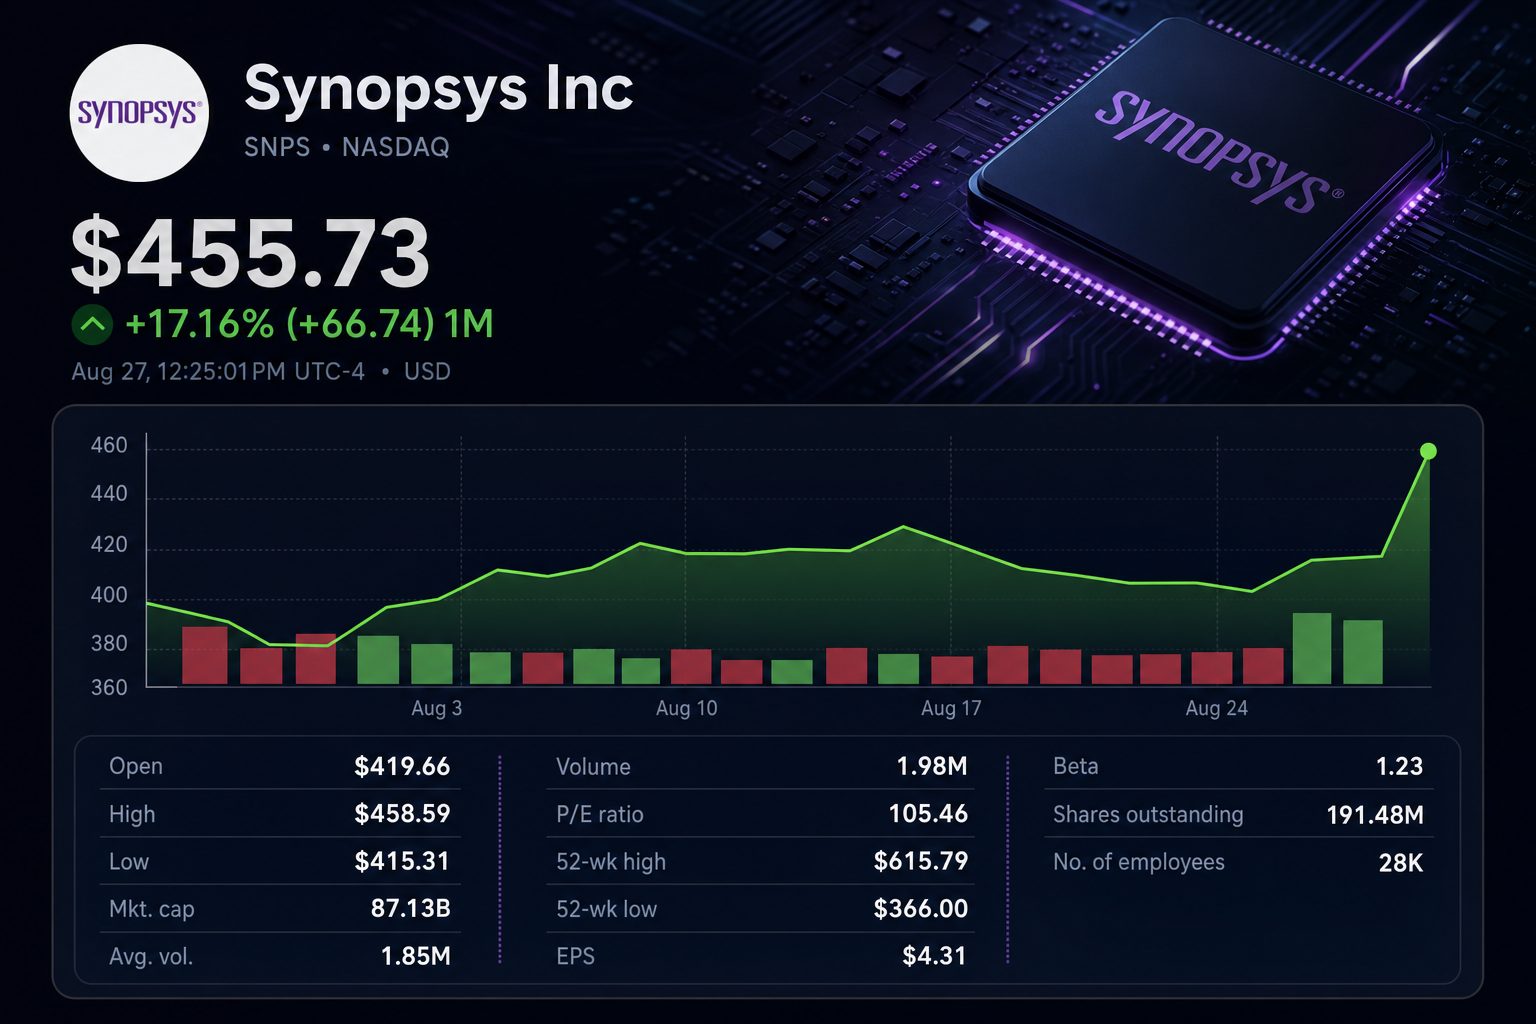
Synopsys, Inc. dropped 3.4% on Friday, wiping out approximately $3.1 billion in market capitalization following a surge on Thursday after earnings. Despite the pullback, the shares stayed about 9.5% higher than before the results were announced.
A $3.1B pullback leaves most of the earnings rerating intact.
Friday retraced about 29% of Thursday’s estimated $10.6B market-value gain.
| Measure | Latest | Signal |
|---|---|---|
| Q3 revenue | $2.477B | +42% YoY |
| GAAP net income | $545.8M | +125% YoY |
| Non-GAAP EPS | $3.91 | Above guide |
| FY revenue midpoint | $9.715B | Raised |
| Operating cash-flow target | ≈$2.8B |
| Free cash-flow target | ≈$2.6B |
| FCF / revenue midpoint | 26.8% |
| Average analyst target | $544.97 |
| Target upside | ≈21% |
Ansys integration costs, slower EDA demand and weaker cash conversion could compress the earnings multiple. The gap between 41.5% non-GAAP and 10.4% GAAP operating-margin guidance remains large.
Q4: $2.530B–$2.580B revenue and $4.10–$4.16 non-GAAP EPS. Full year: $15.04–$15.10 non-GAAP EPS and approximately $2.6B free cash flow.
Sources: Synopsys fiscal Q3 release and financial supplement; market data at 11:33:12 EDT; analyst consensus accessed Aug. 28. Market-value changes are estimates derived from reported price moves and current capitalization. Not investment advice.
| Measure | FY2026 / Q4 range |
|---|---|
| FY revenue | $9.69B-$9.74B |
| FY adjusted EPS | $15.04-$15.10 |
| Q4 revenue | $2.53B-$2.58B |
| Q4 adjusted EPS | $4.10-$4.16 |
| FY operating cash flow | About $2.8B |
| FY free cash flow | About $2.6B |
| Signal | Current reading | What to watch |
|---|---|---|
| Cash + short-term investments | $3.608B | Integration flexibility |
| Outstanding debt | $10.037B | Debt paydown pace |
| Recurring revenue | 82% | Renewal quality and pricing |
| Q3 operating cash flow | $813M | Conversion into free cash flow |
| Metric | Prior | New | Midpoint change |
|---|---|---|---|
| FY2026 revenue | $9.63B–$9.71B | $9.69B–$9.74B | +$45M · +0.47% |
| FY2026 adjusted EPS | $14.72–$14.80 | $15.04–$15.10 | +$0.31 · +2.1% |
| Q4 revenue | — | $2.53B–$2.58B | New range |
| Q4 adjusted EPS | — | $4.10–$4.16 | New range |
| FY2026 free cash flow | — | ~$2.60B | 26.8% of revenue midpoint |